ACMSP096
Construct suitable data displays, with and without the use of digital technologies, from given or collected data. Include tables, column graphs and picture graphs where one picture can represent many data values
- Plus Plan
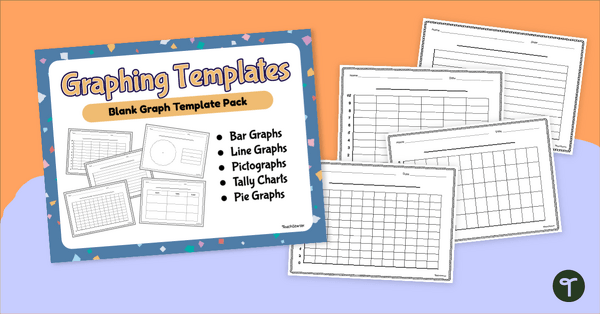
Blank Graph Template Pack
Construct your own graphs with a printable set of Blank Graph Templates.
- Plus Plan
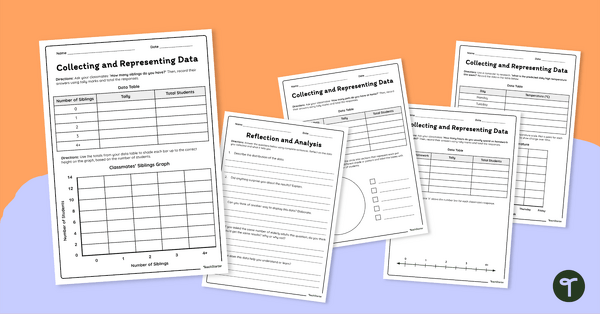
Collecting and Representing Data Worksheet Set
Download our collecting and representing data worksheet set to get your students collecting, organising and displaying data.
- Plus Plan
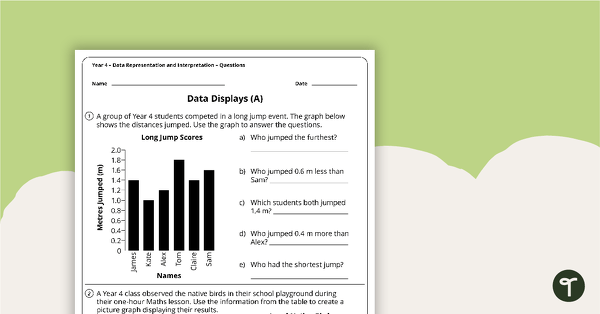
Data Representation and Interpretation Worksheets - Year 4
4 data representation and interpretation worksheets linked to the Australian Curriculum.
- Plus Plan
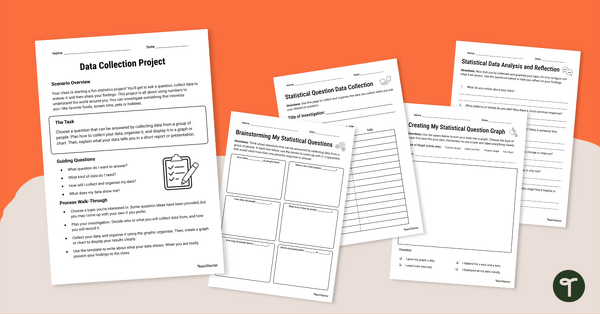
Data Collection Project
Complete this data collection project with your students to give them practise developing a statistical question, collecting data and displaying the results.
- Plus Plan

Data Maths Investigation - Which Reward?
A mathematics investigation involving data collection and representation, embedded in a real-world context.
- Plus Plan

Types of Graphs Posters
Show students the varying data displays they will encounter in their primary maths lessons with these colourful and easy-to-digest visual posters.
- Plus Plan
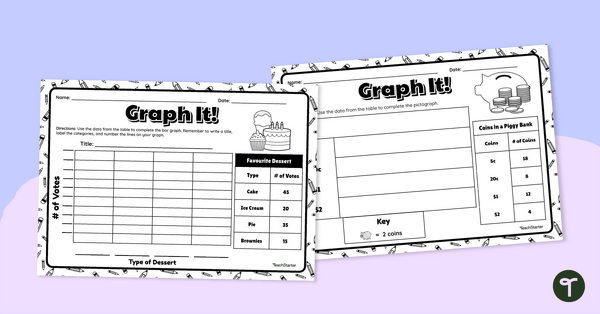
Graph It! Worksheet (Many-to-One Graphs)
Draw a scaled picture graph and bar graph to represent data with this worksheet.
- Plus Plan
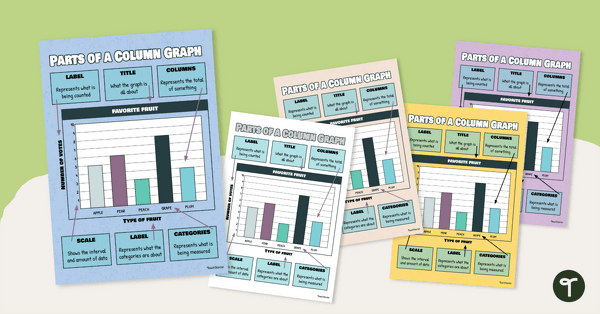
Column / Bar Graph Poster
Hang this column / bar graph poster in your classroom to teach your students about the different parts of this commonly used graph.
- Plus Plan
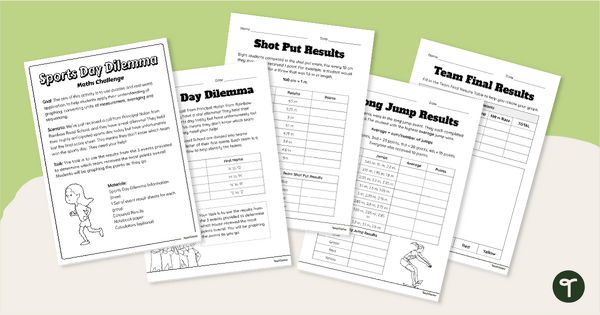
Sports Day Dilemma - Metric Conversions Maths Task
Engage students with a real-world application of measurement conversions with Sports Day Dilemma, a metric conversion maths task!
- Free Plan

Picture Graph Templates
A set of blank picture graph templates for students to represent data.
- Free Plan
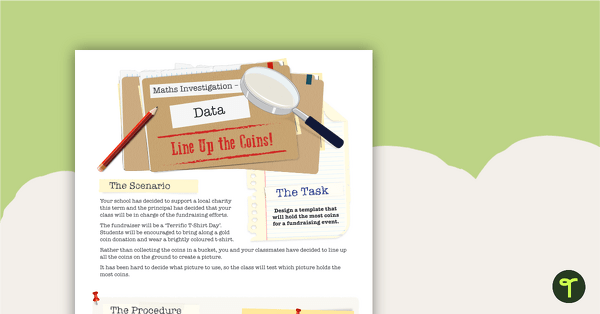
Data Maths Investigation – Line Up the Coins
A mathematics investigation about data, embedded in a real-world context.
- Plus Plan

Types of Graphs Posters and Worksheets
A collection of posters displaying the different types of graphs along with matching worksheets to assist students with laying out graphs on the page.
- Free Plan

Creating a Graph Using Digital Technologies
A worksheet that supports students when collecting initial data and creating a digital graph.
- Plus Plan
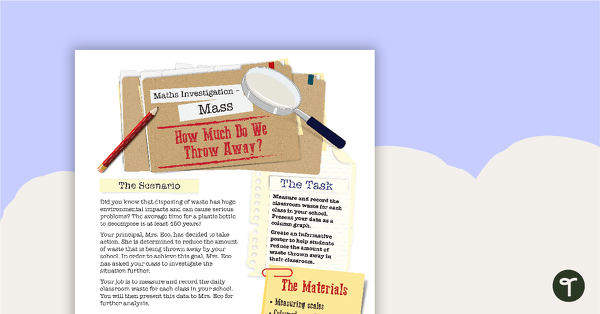
Mass Maths Investigation - How Much Do We Throw Away?
A mathematics investigation about measuring mass, embedded in a real-world context.
- Plus Plan
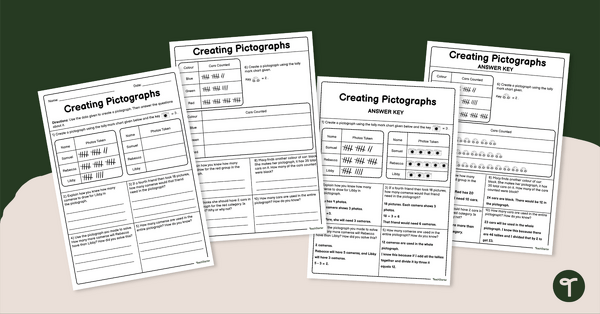
Creating Pictographs Worksheet
Use this engaging worksheet to practice creating and reading pictographs.
- Plus Plan
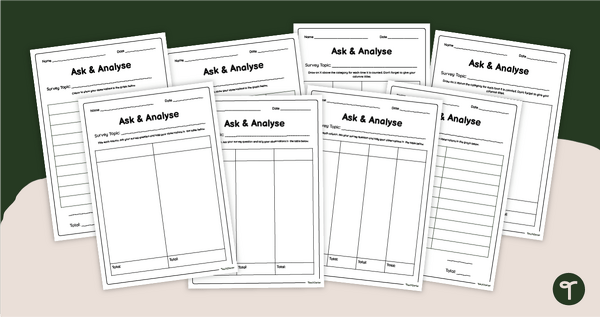
Editable Blank Survey Template For Students
Organise student survey data with a set of printable blank survey templates.
- Plus Plan
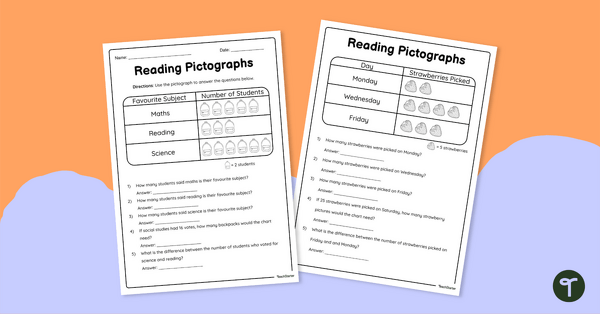
Reading Pictographs - Worksheets
Use this double-sided worksheet to enable students to practise reading and interpreting pictographs.
- Plus Plan
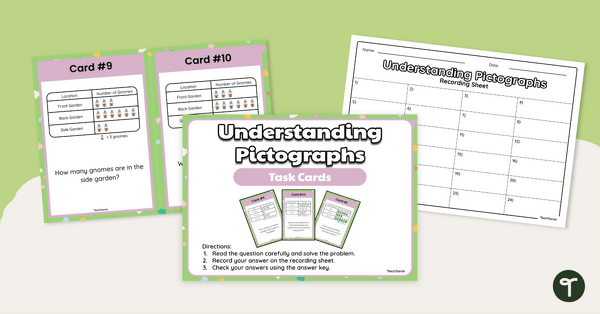
Understanding Pictographs - Task Cards
Use this set of task cards to practise reading and interpreting pictographs and bar graphs
- Plus Plan
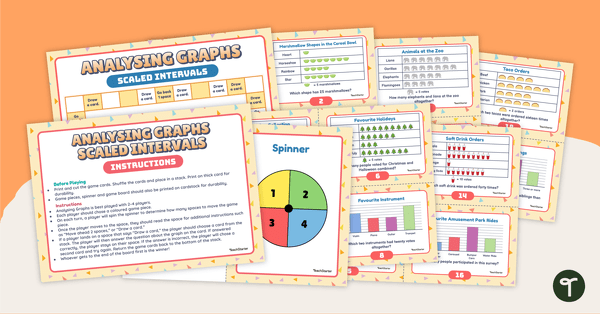
Analysing Graphs (Scaled Intervals) Board Game
Use this board game to sharpen data analysis skills when solving problems with information presented in a scaled picture or column graph.
- Free Plan
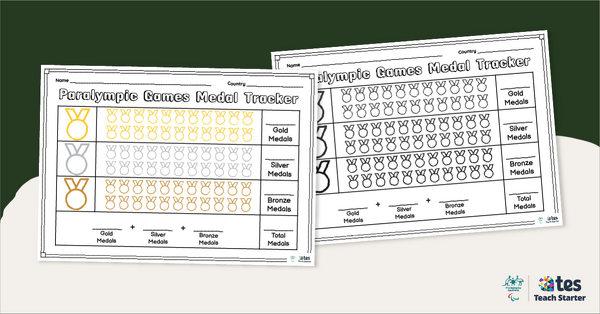
Paralympic Medal Tracking Template
Help your students keep track of the medals won during the Paralympics with our easy-to-use Paralympic medal tracker.
- Plus Plan
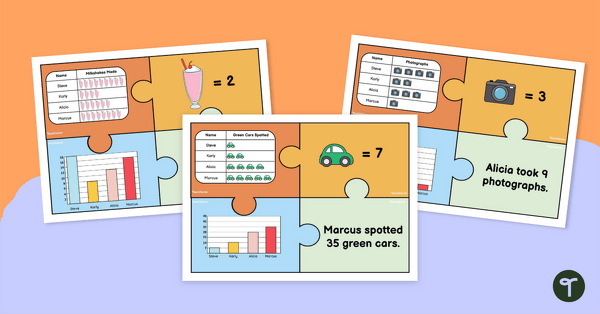
Pictograph Puzzles
Practise reading and interpreting pictographs with these fun puzzles which require students to match pictographs with other data displays with matching data.