Line Graphs Teaching Resources
Make teaching line graphs easy this school year with line graph worksheets, games and more teaching resources aligned with Australian maths curriculum standards.
Teach students how to make line plots, how to find specific data points and interpret trends and more core data analysis skills with printable and digital resources created by Aussie teachers for teachers like you!
This collection of resources has been carefully reviewed by the expert teachers on the Teach Starter team to ensure every single one is ready to use in the classroom. That means you can save hours on lesson planning with activities ready to print or use digitally!
Want to learn more about how to teach line graphs, or just looking for fresh ideas to engage your students? Read on for a primer from our teacher team.
What Is a Line Graph? A Kid-Friendly Definition
We believe it helps to have simple definitions at hand when you're introducing core maths concepts to your class. That's why you'll find definitions for tonnes of topics on the Teach Starter site.
Here's a kid-friendly definition of line graph you can use to explain the meaning to your students:
A line graph is a tool we use to represent data and show how something changes over time. This type of graph makes it easy to see trends in data because it offers a visual representation of the numbers.
For example, let's say the number of students attending your primary school changed from the beginning of the school year to the end. If you wanted to see how large the change was and when the changes occurred, you could use a line graph to show the number of students who were attending a school at the beginning of the school year, at the end of term 1, at the start of term 2 and so on — all the way through the end of the year.
The line graph would make it easy to see when the most new students arrived or the most students left the school.
How to Make a Line Graph Step-by-Step
Are you teaching students how to make a line graph? Here's a simple step-by-step to help guide them!
- Gather your data! To plot a line graph, the data needs to include pairs of values (x, y) where x is the independent variable and y is the dependent variable.
- Draw and label a horizontal x-axis and a vertical y-axis on a piece of grid paper or graphing paper.
- Identify the variables you will be plotting on each axis. The x-axis usually includes increments of time, such as the day, month or year. The y-axis is typically used for numerical data.
- Label each axis. You may need to add units in addition to the variable each axis represents.
- Determine the scale for each axis. The graph scale should allow you to represent all your data clearly.
- Plot each data point on the graph by locating the corresponding x and y values on the axes and marking the intersection point. If a data point has coordinates (x, y), move along the x-axis to x and then move up or down along the y-axis to y.
- Draw the line that gives this tool its name! Your line should connect your data points, and it will help you identify the relationship or trend between the different points of data.
- Give your line graph a title that describes what it shows.
- Collect data on changes to a class pet or class plant to plot on a line graph.
- Record the temperature over the course of a week or two and plot the changes along a line plot.
- Record the number of minutes you spend reading independently each day, and create a line graph to show how your reading time changes (or stays the same!).
Line Graph Examples for Kids
Do you need a few line graph examples for kids to get your students started on their data plotting?
Here are a few simple ideas that make great line graphs!
- Plus Plan
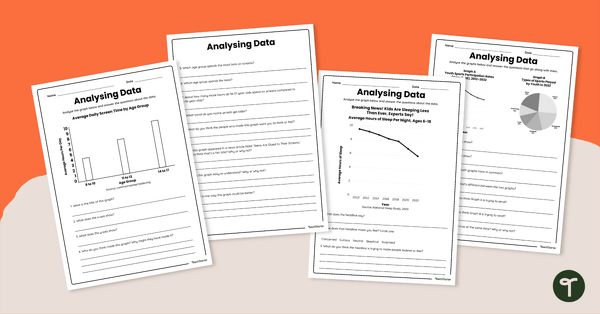
Analysing Data Worksheet Set
Share this analysing data worksheet set with your students to give them varied practice interpreting multiple data representations.
- Plus Plan
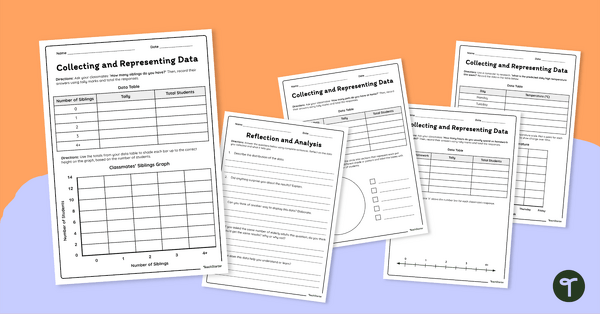
Collecting and Representing Data Worksheet Set
Download our collecting and representing data worksheet set to get your students collecting, organising and displaying data.
- Plus Plan
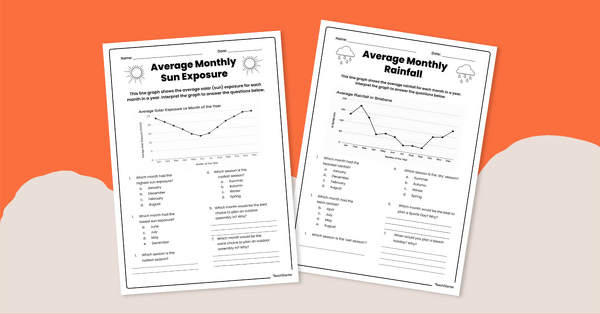
Interpreting Line Graphs Worksheet Pack
Use this set of 4 Grade 5 worksheets to help students practise interpreting real-life data represented as a line graph.
- Plus Plan
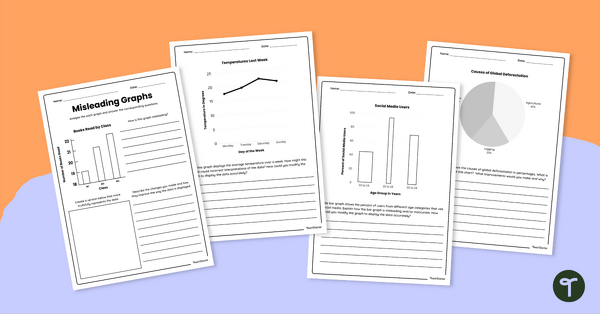
Misleading Graphs Worksheet Set
Download our misleading graphs worksheet set to increase your students’ abilities in statistical literacy and data analysis.
- Plus Plan
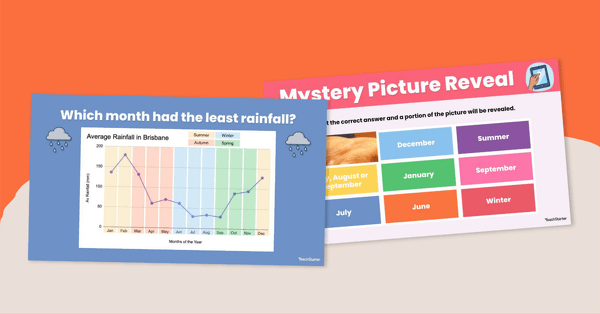
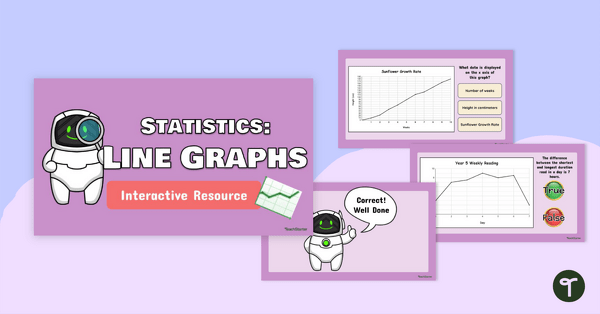
Interpreting Line Graphs Interactive Resource
Use this digital activity to teach students about interpreting real-life data represented as a line graph showing how measurements change over a period of time.
- Plus Plan
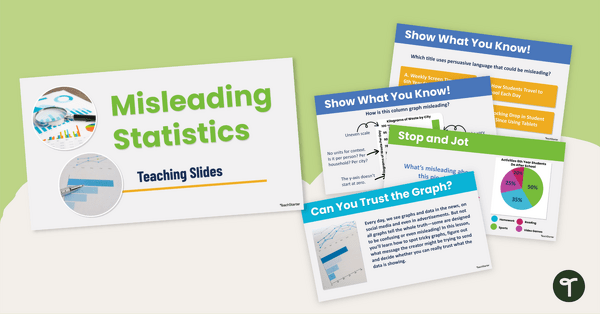
Misleading Statistics Teaching Slides
Use our misleading statistics teaching slides to increase statistical literacy and teach your students how to look at data displays with a critical eye.
- Plus Plan
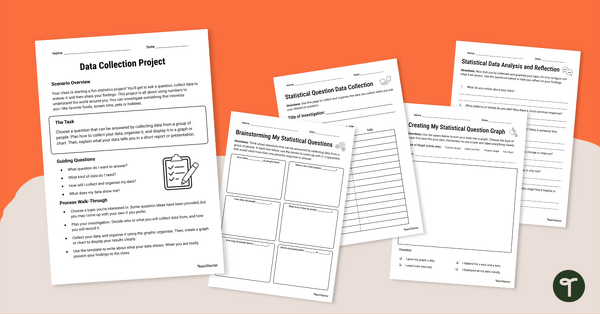
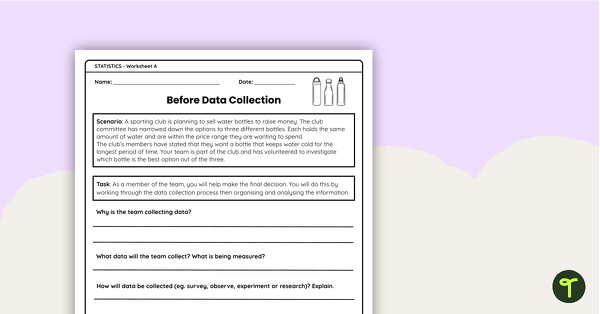
Data Collection Project
Complete this data collection project with your students to give them practise developing a statistical question, collecting data and displaying the results.
- Plus Plan
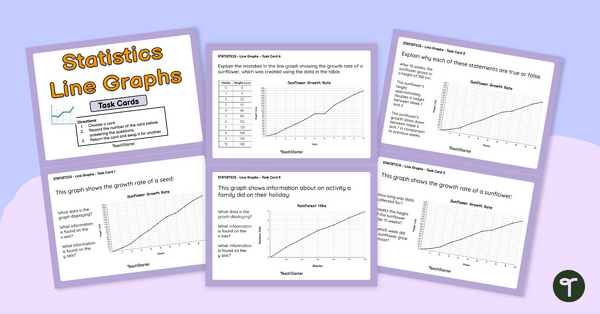
Interpreting Line Graphs Task Cards Grade 5
Use these task cards in your maths class to have students independently analyse and interpret line graphs.
- Plus Plan
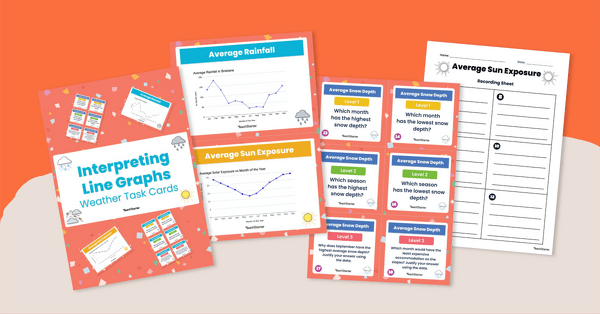
Interpreting Line Graphs Task Cards
Engage your Grade 5 learners with this task card set focused on interpreting line graphs.
- Plus Plan
Interpreting Line Graphs Interactive Activity Grade 5
Solve the space man's line graph questions and complete the challenge with this interpreting line graphs interactive game!
- Plus Plan
Interpreting Line Graphs Grade 5 Worksheet Set
- Plus Plan
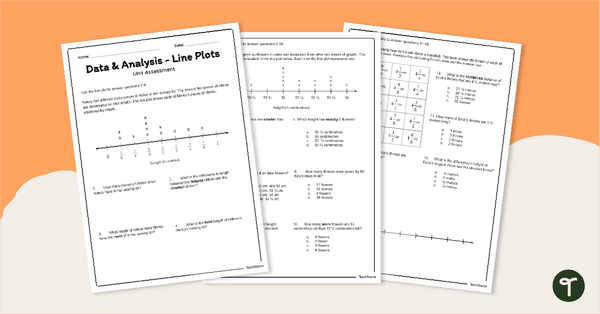
Line Plots / Dot Plots - Year 5 Assessment
Assess student understanding of reading and creating dot plots/line plots with a printable assessment for Year 5.
- Plus Plan
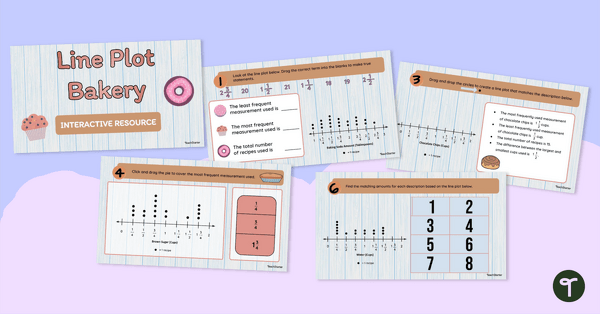
Dot Plot Bakery Interactive Activity
Strengthen dot plot skills with this bakery-themed interactive activity, designed to help students practise creating and analysing dot graphs in a fun, structured way.
- Plus Plan
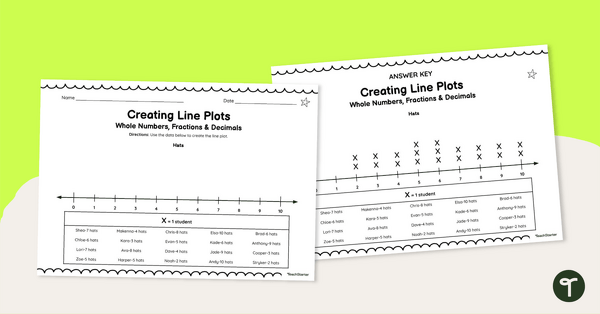
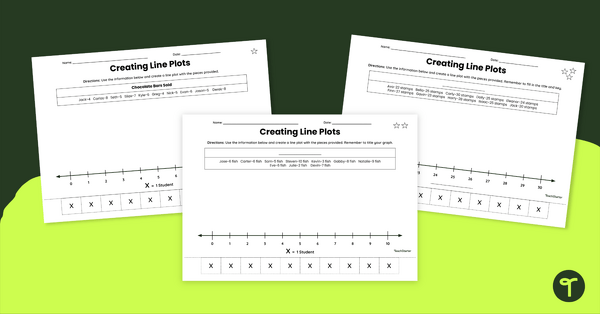
Creating Line Plots (With Whole Numbers, Fractions and Decimals) Worksheets
Help your students master data representation with this series of leveled worksheets for creating line plots.
- Plus Plan
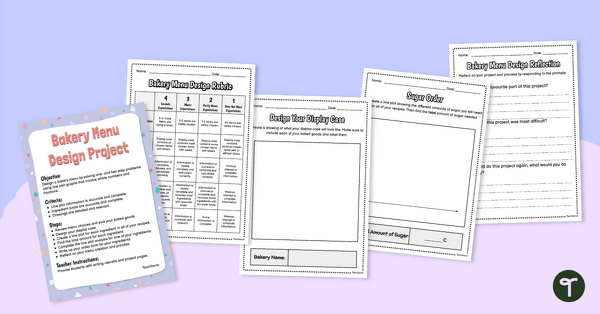
Line Plot Project: Bakery Menu Design
Make learning about maths as sweet as your students' favourite treats with this project based learning line plots exercise!
- Plus Plan
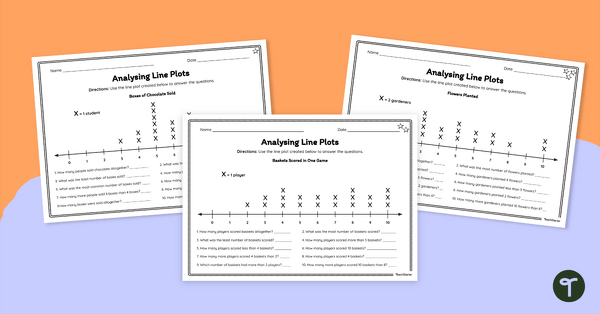
Analysing Line Plots – Differentiated Worksheets
Empower your students to become proficient data interpreters with this set of differentiated line plot worksheets.
- Plus Plan
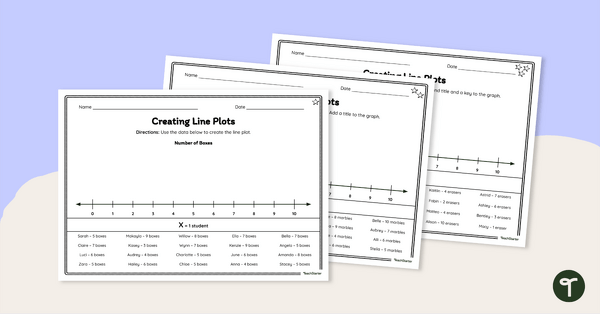
Creating Line Plots Differentiated Cut and Paste Worksheet
Guide students to create line plots with this differentiated cut and paste worksheet.
- Plus Plan
Differentiated Line Plot Worksheet
Guide your students to represent data with this differentiated line plot worksheet.