Graphic Organisers for Teachers
The blank graphic organisers and printable graphic organiser templates you need most for your primary school classroom are here! Help your students learn to brainstorm ideas and organise information with editable templates you can customise for your classroom.
Carefully designed and curated by our expert teacher team, each of the maps, charts and diagrams in this collection of templates has been created with the needs of students in mind. Many are even already aligned to the Australian curriculum to save you much-needed time in your lesson planning.
You'll find:
- Printable Venn Diagram templates
- T-charts
- KWLs
- Story maps
- Concept diagrams
- Concept maps
- Knowledge maps
- Cognitive organisers
- Advance organisers
- Brainstorming templates
Not familiar with this teaching tool, or just looking for some fresh ideas for using them in the classroom? Read on for a primer from our teacher team!
What Is a Graphic Organiser?
A graphic organiser, by definition, is a visual guide that breaks down the relationships between ideas, vocabulary or facts within a learning task. These learning tools scaffold learning for students, allowing them literally construct knowledge. Pretty neat, huh?
Graphic organisers can take the form of templates, charts, or diagrams and be specific to one topic or generalised for use across a range of subjects.
Printing blank templates allows students to use the tool to design their learning, explore relationships between concepts and use their evaluation and judgment skills to determine where information should be added to the organiser.
Types of Graphic Organiser Examples
So what are the different types of graphic organisers in this collection? Let's take a look at some examples and how to use them!
Concept Maps
The term 'map' for this graphic organiser refers to the fact that it shares some similarities with a traditional map.
A map of a country or state can visually represent the geographic layout of different places and their relationships. Similarly, a concept map visually represents the connections and relationships between various ideas or concepts. This helps students organise their thoughts and understand the relationships between different topics, as well as helping kids understand the overall structure of a topic.
Venn Diagrams
A Venn diagram is used to show the logical relationships between two or more sets of items. This tool is named for John Venn, a mathematician, logician and philosopher known for his work in probability.
Although a classic Venn diagram is made up of overlapping circles, other shapes can be used with this graphic organisation tool. And while a Venn Diagram is often made up of just two or three circles, some forms can encompass larger numbers of shapes.
Especially useful in maths and English classes, a Venn diagram can help students easily analyse similarities and differences between characters, objects or concepts. For example, a student might use a Venn diagram in maths to sort and classify numbers or geometric shapes.
Story Maps
A story map is a graphic organiser that can help English students understand the elements of a story — concepts such as characters, setting, plot and resolution.
This helpful tool gives kids a visual outline of the story's structure and helps students identify key elements and their relationships, plus it helps them track plot progression.
KWL Charts
KWL stands for Know-Want to know-Learned, and charts built around this acronym count as graphic organisers! They're used to activate prior knowledge, guide inquiry-based learning and track learning progress.
The goal is for students to fill in what they already know about a topic, what they want to learn, and what they have learned. This gets kids to engage with the content and ask questions!
Cause and Effect Charts
Typically used in history or science, cause and effect charts help students understand the relationship between events or actions.
For example, students can use one of these charts to identify the causes and consequences of a specific event in history or to analyse cause-and-effect relationships in a science experiment.
Flowcharts
Flowcharts use symbols and arrows to represent a sequence of steps or events. This type of organiser tends to be used in subjects like science and maths to help kids visualise processes, procedures and problem-solving strategies.
In science, for example, a student might use a flowchart to illustrate the steps of the water cycle. They could use symbols and arrows to represent each stage, starting with 'Evaporation," followed by 'Condensation,' 'Precipitation' and 'Collection.' Arrows would then connect the steps logically, showing the water flow through the cycle.
Mind Maps
Yup, we have yet another kind of map on this list! Mind maps are diagrams that start with a central idea and branch out to represent related concepts or ideas visually.
You can use these organisers for brainstorming, organising thoughts and making connections between different pieces of information, and they come in handy across a broad range of school subjects.
In writing, for example, a student could use a mind map to generate ideas or outline an essay. Meanwhile, in science class, mind maps can help a student explore different branches of a scientific concept or create visual summaries of key scientific principles.
Comparison Charts
Comparison charts help students analyse similarities and differences between two or more objects, concepts or ideas. They are used to compare and contrast information, such as characteristics of animals, historical figures or different geographical locations.
Let's say a student needs to compare two animals in science class — an elephant and a giraffe.
They could use a comparison chart with columns for different attributes like Size, Habitat, Diet and Physical Features. Under each column, they would then fill in the specific characteristics and compare how elephants and giraffes are different or share similarities.
Timelines
As a graphic organiser, a timeline provides a structured framework for organising and presenting information visually. Students can see the progression of events over time, making it easier to understand historical developments, story plots or the sequence of steps in a process.
A timeline typically includes a horizontal or vertical line representing a specific timespan. Specific points or intervals are marked along the line to indicate specific events or periods. Events are then labelled and positioned relative to when they happen — this way kids can more easily grasp the order of each event and how long each one lasted.
Problem-Solution Charts
Problem-solution charts help students analyse problems and create potential solutions. They typically include sections for identifying the problem, brainstorming possible solutions and evaluating the best way forward.
This organiser can help kids plan a project like solving the problem of waste in the cafeteria. They could identify that the garbage can is always full of items that could be recycled, brainstorm ways to address the issue and come up with a plan to add recycling bins beside the garbage can.
T-Charts
T-Charts are fairly simple graphic organisers.
They divide information into two columns — a line at the top and a line down the centre give this organiser its name — and help students compare and contrast information or categorise data into two categories.
Benefits of Graphic Organiser Templates
Should you use this tool in your classroom to support your students' learning goals? We can't tell you that — but just look at the benefits of graphic organisers!
A graphic organiser helps students organise their ideas, drawing out relationships between ideas or concepts and expressing them in a graphic display. These visual representations or guides may also help students to retain information.
Not sure which organiser you and your students need?
Don't worry; this collection of teaching resources has them all covered!
- Plus Plan
Frayer Model Template
Work on your students' vocabulary development with this Frayer Model template.
- Plus Plan
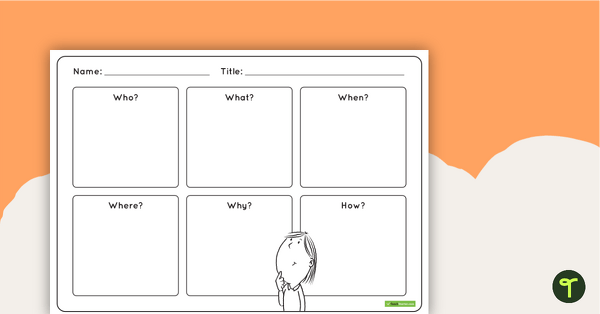
5 Ws and 1 H Planning Worksheet for Narrative Writing
A 5 Ws and 1 H worksheet to use in the classroom.
- Plus Plan
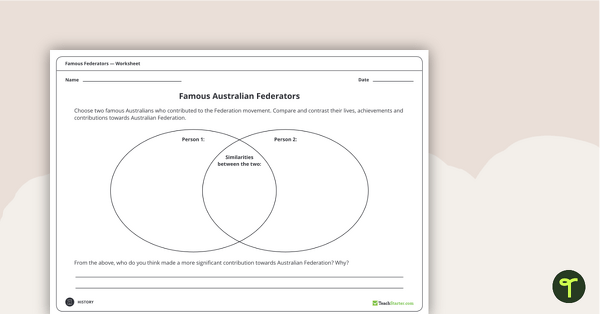
Famous Australian Federators - Venn Diagram
A Venn Diagram to use in the classroom when exploring significant people who contributed to Australian Federation.
- Plus Plan
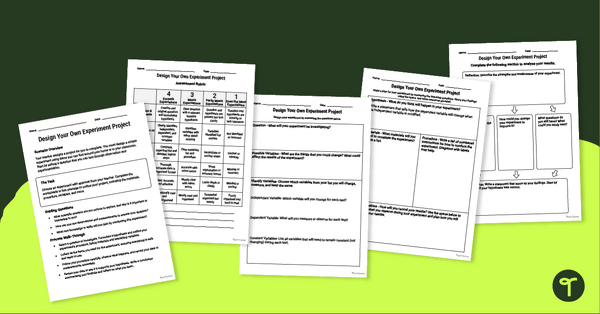
Design Your Own Science Experiment Project
Design your own science experiments and science fair projects with an experimental design project guide and planning templates.
- Plus Plan
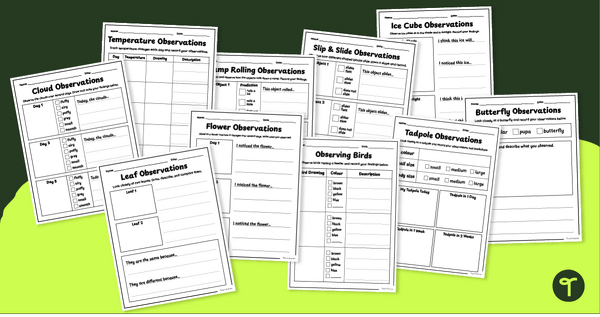
Scientific Prediction & Observation Templates
Introduce your early learners to scientific inquiry skills with a set of printable Scientific Observation templates.
- Plus Plan
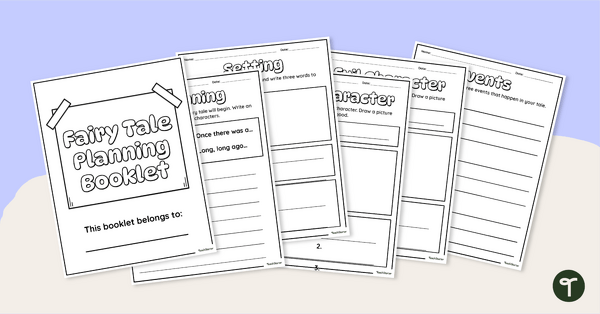
Fairy Tale Writing Templates
Use these structured pages to support storytelling and writing of fairy tales with your students.
- Plus Plan
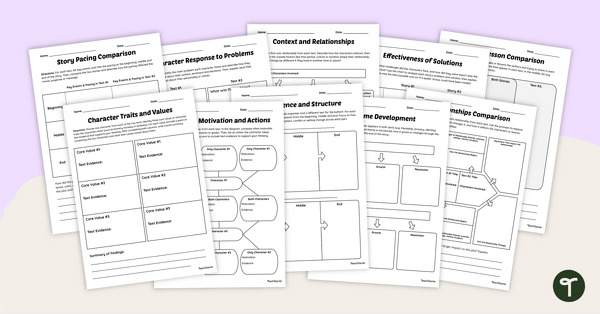
Comparing and Contrasting Texts Graphic Organisers
Support students in comparing and contrasting texts with this versatile set of graphic organisers designed to deepen comprehension and enhance classroom discussions.
- Plus Plan
Vocabulary Foldables for Interactive Notebooks
Use Vocabulary Foldables to help your students demonstrate and review a variety of vocabulary concepts.
- Plus Plan
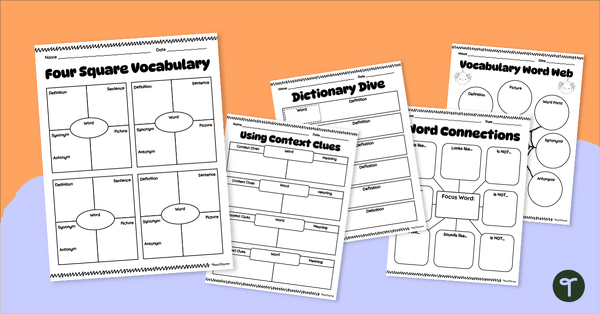
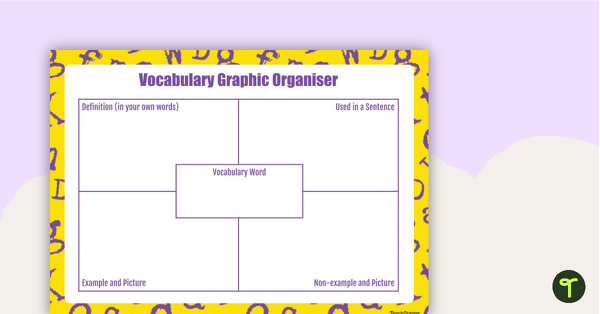
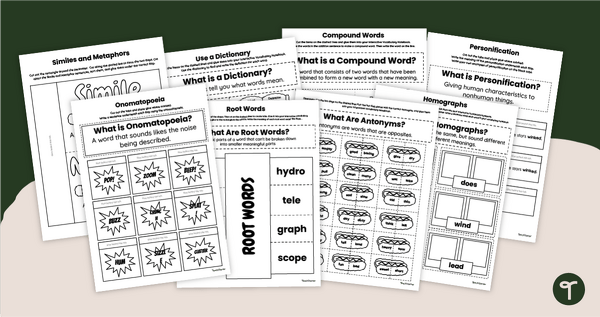
Vocabulary Graphic Organisers
Use printable vocabulary graphic organisers to help your upper-primary students develop their academic and conversational vocabulary skills.
- Plus Plan
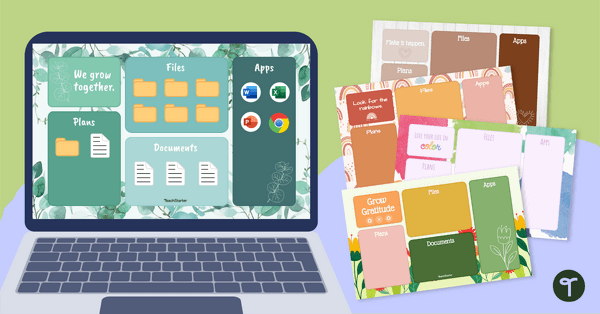
Teacher Computer Desktop Wallpapers
Organise your computer desktop with bright and cheery motivational desktop wallpapers for teachers!
- Plus Plan
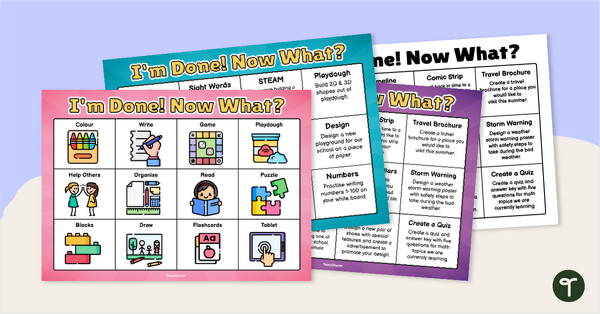
I’m Done, Now What? Early Finisher Activities Board
Provide your early finishers with a fun activity choice board to answer the question: I’m Done, Now What?
- Free Plan
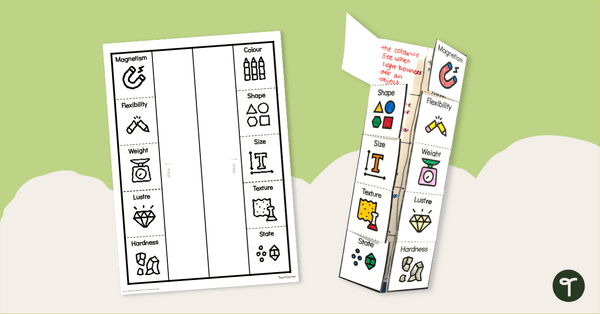
Physical Properties of Matter Vocabulary Foldable
Introduce your students to observable and measurable properties of matter with a printable Properties of Matter Vocabulary Foldable.
- Plus Plan
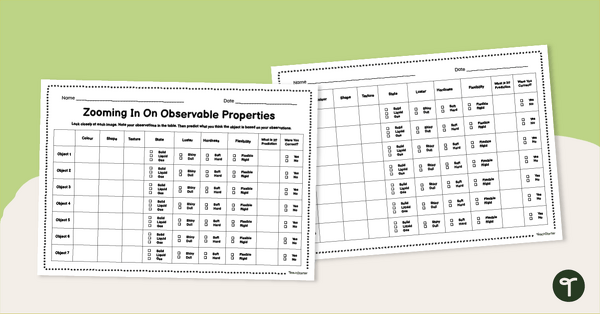
Zooming in On Matter and Properties of Matter Graphic Organiser
Use a Matter and Properties of Matter Graphic Organiser to explore and identify examples of matter in your upper-year science classes.
- Plus Plan
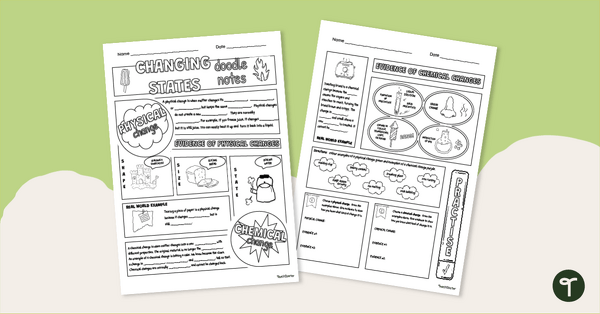
Chemical and Physical Changes in Matter Doodle Notes Template
Use our Chemical and Physical Change Doodle Notes Template to encourage your students to understand more about changes in matter.
- Plus Plan
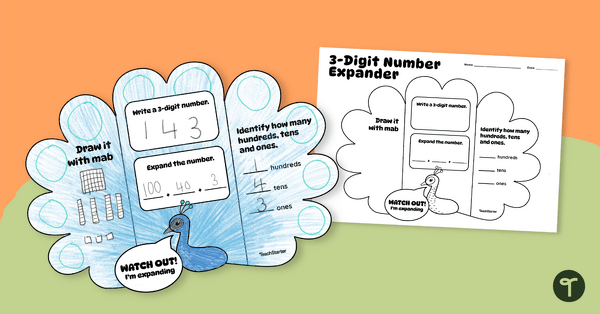
3-Digit Number Expander Template (Peacock)
A foldable peacock-themed number expander for students to record 3-digit place value.
- Free Plan
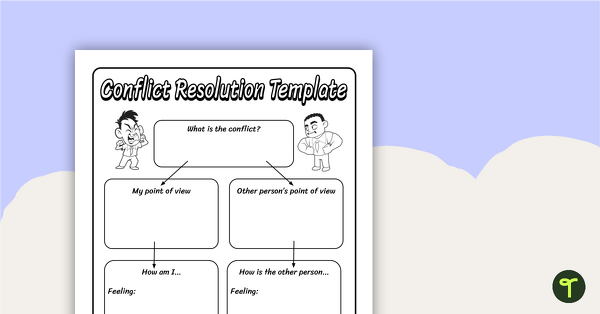
Conflict Resolution Template
Manage classroom and playground conflicts positively and proactively with this conflict resolution template.
- Plus Plan
Character Traits Graphic Organiser
Describe the most notable mental and moral qualities of a real or fictional person.
- Plus Plan
Making Text Connections Graphic Organiser (F–2)
A graphic organiser to use with students when making connections with a text.
- Plus Plan
Internet Research - Graphic Organiser
A blank graphic organiser for students to use when planning an Internet research task.
- Free Plan
Proposing a New Law - Worksheet
Propose a new law for your classroom or country with this guided Civic and Citizenship worksheet.
- Free Plan
Research Notes Template
A template for students to use when recording research notes.
- Plus Plan
See, Think, Wonder Template
A See, Think, Wonder Template is useful in encouraging students to make careful observations and interpretations.
- Free Plan
Day and Night Venn Diagram
Brainstorm the similarities and differences between day and night using this Venn Diagram worksheet with your students.
- Free Plan
Word of the Week (or Day) – Graphic Organiser
Boost your students' vocabulary with this engaging Word of the Week/Word of the Day graphic organiser!
- Plus Plan
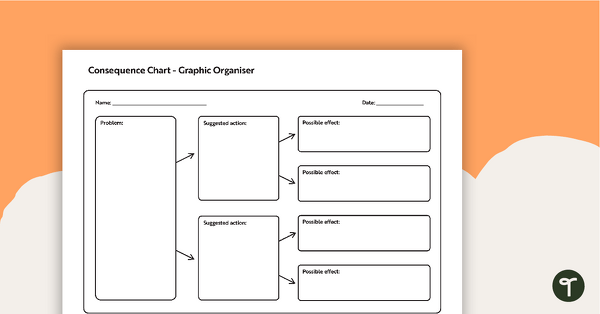
Consequence Chart Graphic Organiser
A blank consequence chart graphic organiser.
- Plus Plan
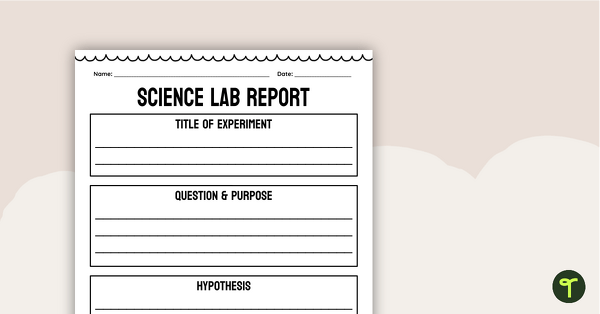
Science Lab Report Template
Use a Science Lab Report Template to help your students organise their findings in any scientific method lab experiment.
- Plus Plan
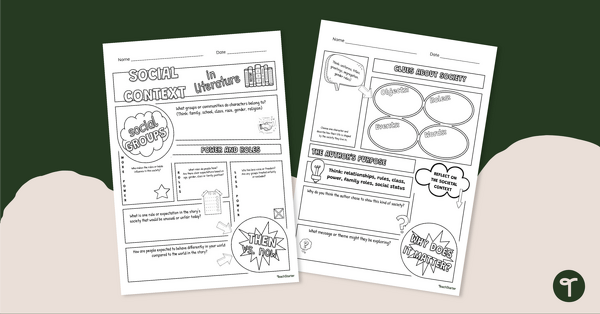
Social Context in Literature Graphic Organiser
Support students to explore social context in literature with this two-page graphic organiser that helps them explore societal norms in a piece of literature.
- Free Plan
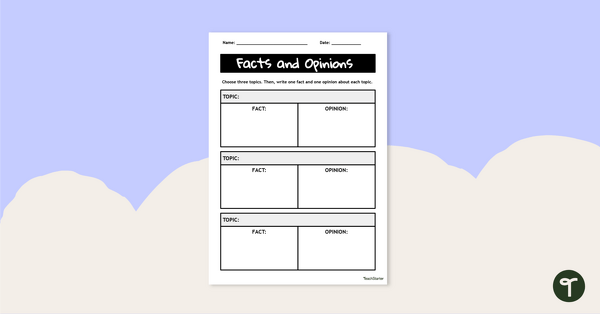
Fact and Opinion Graphic Organiser
Use this fact and opinion graphic organiser to get your students writing facts and opinions for a variety of topics.
- Plus Plan
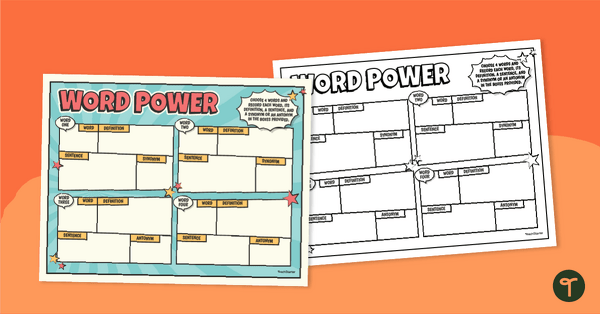
Comic-Inspired Vocabulary Sheet
Expand your students’ vocabulary skills with our Word Power! Comic Book-Inspired Vocabulary Sheet!
- Plus Plan
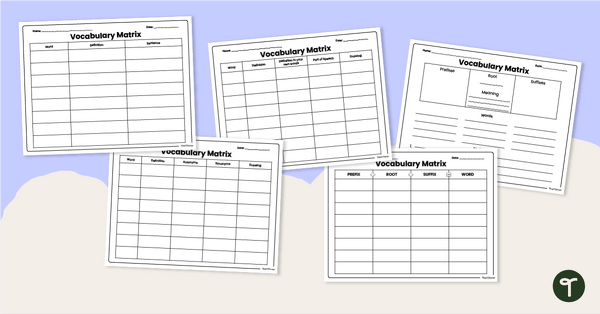
Printable Vocabulary Word Matrix Templates
Use a printable vocabulary word matrix template to help your students organise and remember important vocabulary words.
- Plus Plan
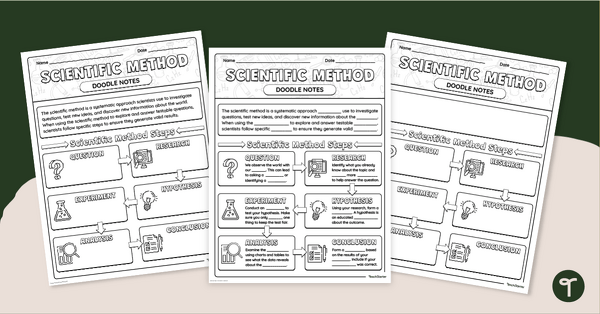
Differentiated Scientific Method Doodle Notes Templates
Use scientific method doodle notes to turn learning the scientific method into a meaningful note-taking session for students!
- Plus Plan
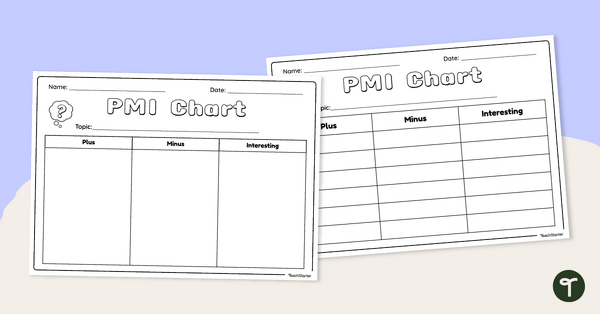
Plus Minus Interesting Chart
Use this Plus Minus Interesting Chart set in any subject area to get your students talking!