
Use an Autumn Maths Worksheet to practise counting and graphing.
Count and Graph With New Autumn Maths Activities From Teach Starter!
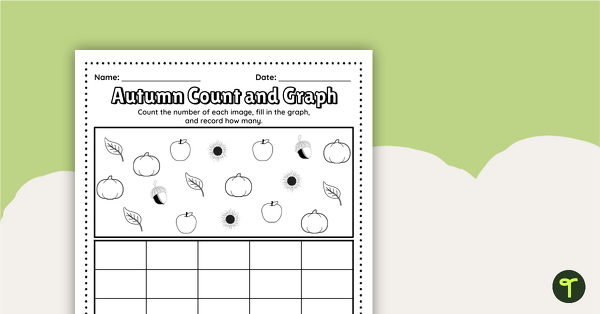
Are you on the hunt for Autumn maths activities for Foundation and Grade One students? We’ve got a handy count and graph worksheet to help your students “Fall” into counting and creating bar graphs. Our autumn maths activities will have your students counting to ten and graphing in no time!
To play, students will look at the pictures on the worksheet and count them. They will then record the number of objects they counted with the same symbol. Finally, students will graph their results by colouring in the bar graph.
Through this activity, students will show they can count objects up to ten and convert data into a bar or column graph.
Downloading Your Autumn Maths Worksheets
Use the dropdown icon on the Download button to choose between the PDF or Google Slides version of this resource.
Since this resource includes an answer key, we recommend printing a single copy of the file, then making copies from your original.
This resource was created by Lindsey Phillips, a teacher and Teach Starter collaborator.
More Autumn Maths Activities and Resources
Don’t stop there! We’ve got more autumn maths activities and resources that cut down on lesson planning time:
teaching resource
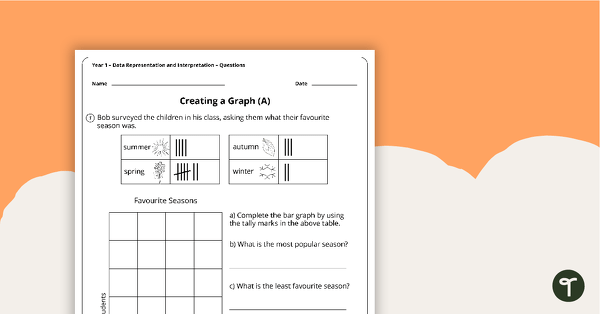
Data Representation and Interpretation Worksheets - Year 1
Two data representation and interpretation worksheets linked to the Australian Curriculum.
teaching resource
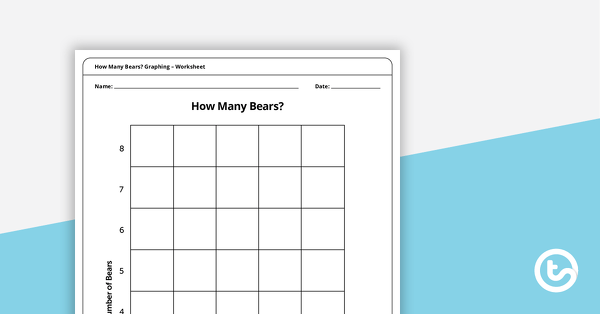
How Many Bears? Graphing – Worksheet
A hands-on picture graph worksheet for students to sort and count coloured bears.

teaching resource
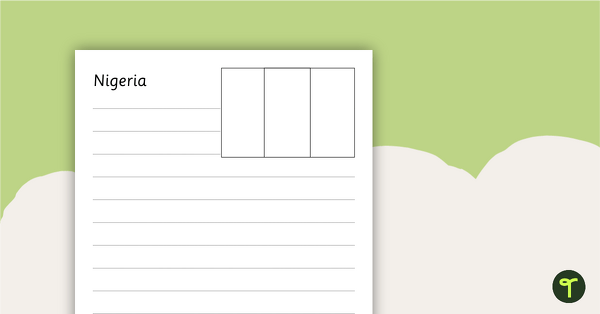
Picture Graph Templates
A set of blank picture graph templates for students to represent data.

0 Comments
Write a review to help other teachers and parents like yourself. If you'd like to request a change to this resource, or report an error, select the corresponding tab above.