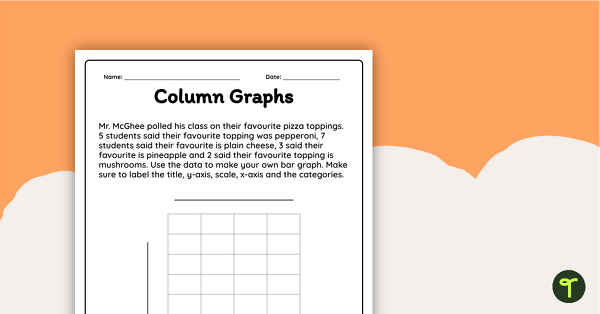
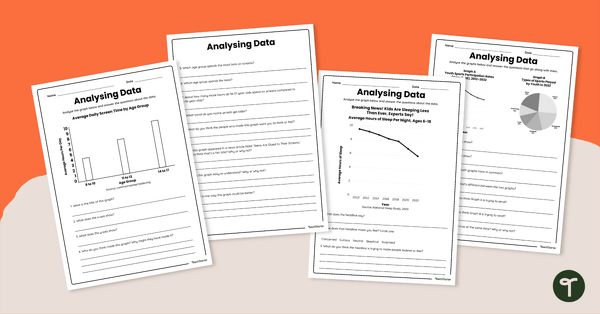
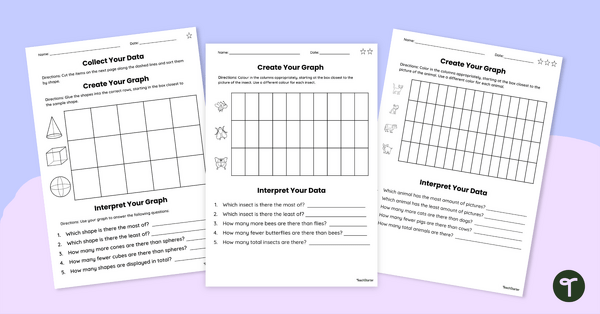
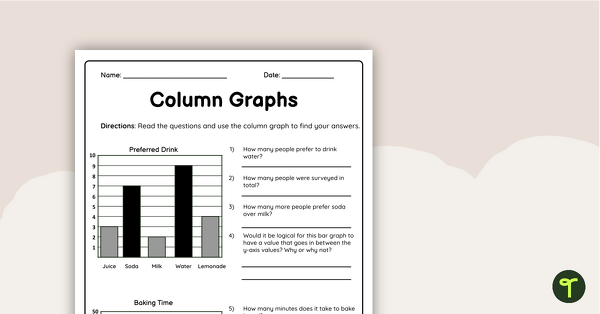
Interpret data and create a column graph display with this worksheet.
Creating a Column Graph Worksheet
Displaying data using appropriate graph types is an important skill students learn in year 3. With this worksheet, students will be given data they must interpret and then create a column graph using a grid template.
Students need to include the following features on their column graph:
- graph title
- axis headings
- labels for each column
- an appropriate scale
- shaded columns.
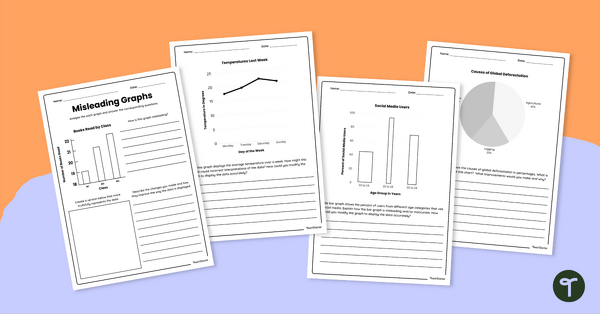
Three versions are included in the resource. Two versions have information in a paragraph at the top of the page which gives students the data for their graph. One has a blank template and another with a partially filled template. The third is an open-ended blank template where students will collect their own data. Choose the best option for your students.
An answer key is included with your download to make marking fast and easy!
Tips for Differentiation + Scaffolding
Extend students by asking them to create a different type of graph representing the same information. Have them choose which graph is the better representation and justify their choice.
For students who need extra support, progress through the worksheet alongside the Column Graphs Teaching Presentation. This will allow students to think of the pieces necessary to complete the graph. Alternatively, provide these students with the partially filled worksheet.
In addition to individual student work time, use this worksheet as a:
- rotation for guided maths groups
- lesson exit ticket
- fast finisher activity
- homework assignment
- whole-class review (via smartboard).
Easily Download & Print
Use the dropdown icon on the Download button to choose between the PDF or Google Slides version of this resource.
Turn this teaching resource into a sustainable activity by printing on cardboard and slipping it into a write-and-wipe sleeve. Students can record their answers with a whiteboard marker, then erase and reuse.
Get more handy worksheets here!
This resource was created by Kendall Britnell, a Teach Starter Collaborator.

0 Comments
Write a review to help other teachers and parents like yourself. If you'd like to request a change to this resource, or report an error, select the corresponding tab above.