teaching resource

Column Graphs Grade 5 Worksheet

  • Updated

    Updated:  07 Aug 2023

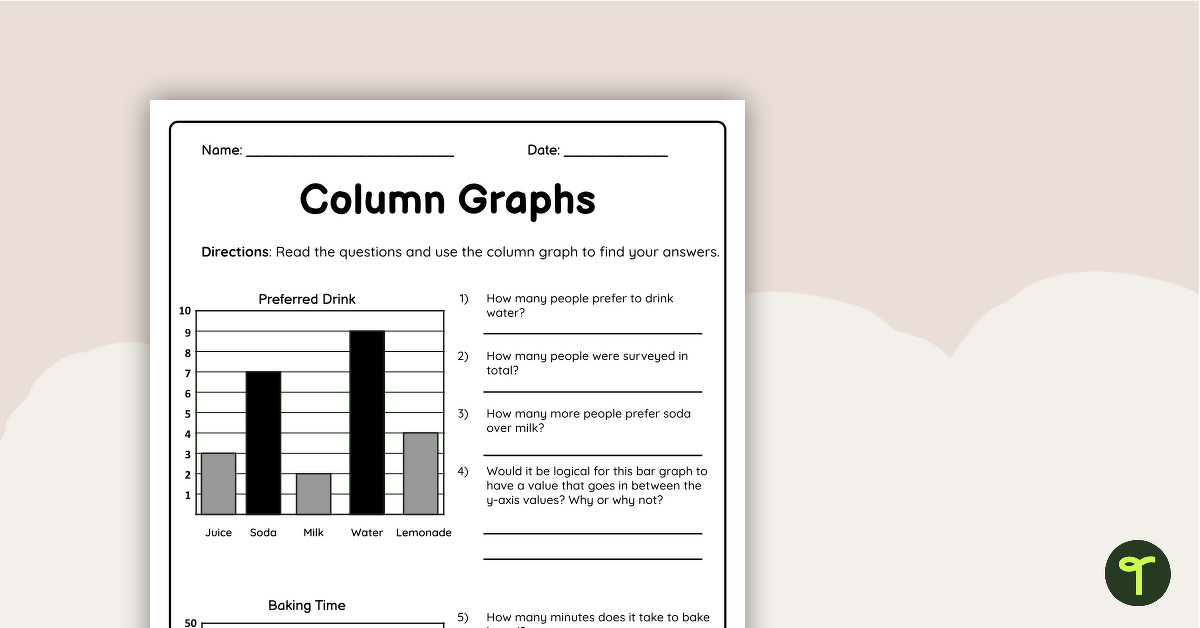
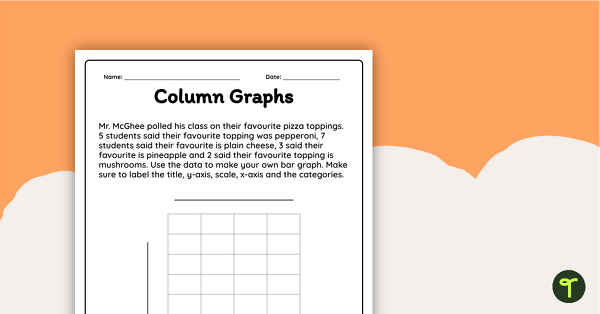
Use this double-sided column graphs worksheet to check your students’ understanding of interpreting and drawing column graphs.

  • Editable

    Editable:  Google Slides

  • Non-Editable

    Non-Editable:  PDF

  • Pages

    Pages:  4 Pages

  • Curriculum
  • Year

    Year:  5

Curriculum

  • VC2M5ST01

    Acquire, validate and represent data for nominal and ordinal categorical and discrete numerical variables to address a question of interest or purpose using software including spreadsheets; discuss and report on data distributions in terms of highest frequency (mode) and shape, in the context of the data <ul> <li>recognising that ordinal data is a form of categorical data even though the data being collected might be numbers, for example, a rating scale using numbers 1–5 to represent the categories people can choose from when asked, ‘What rating would you give this film out of 5?’</li> <li>determining the mode for a set of data and discussing that there may be more than one mode</li> <li>identifying the best methods of presenting data to illustrate the results of investigations and justifying the choice of representations</li> <li>acquiring data through chance experiments, discussing and reporting on the distribution of outcomes and how this relates to equal and unequal outcomes</li> <li>using digital systems to validate data; for example, recognising the difference between numerical, text and date formats in spreadsheets, and setting data types in a spreadsheet to make sure a date is input correctly</li> <li>investigating data relating to the reconciliation process between Aboriginal and Torres Strait Islander Peoples and non-Indigenous Australians, posing questions, discussing and reporting on findings</li> </ul>

teaching resource

Column Graphs Grade 5 Worksheet

  • Updated

    Updated:  07 Aug 2023

Use this double-sided column graphs worksheet to check your students’ understanding of interpreting and drawing column graphs.

  • Editable

    Editable:  Google Slides

  • Non-Editable

    Non-Editable:  PDF

  • Pages

    Pages:  4 Pages

  • Curriculum
  • Year

    Year:  5

Use this double-sided column graphs worksheet to check your students’ understanding of interpreting and drawing column graphs.

Column Graph Worksheet — Interpret and Create Column Graphs

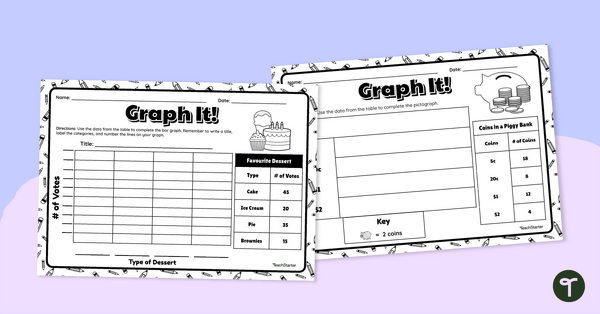
This double-sided worksheet requires Grade 5 students to analyse and construct column graph data displays. They will answer eight questions relating to two sample column graphs, and create two column graphs of their own. An answer key is provided for easy marking!

Tips for Differentiation + Scaffolding  

In addition to individual student work time, use this worksheet as a:

To make this worksheet more of a challenge for students who are waiting for others to finish, edit the worksheets in Google Slides to create more challenging graphs to that skip count on more advanced intervals.

For students who need additional support, edit the file to only include whole-number increments and alter the questions to only result in whole-number/single interval answers. 

Easily Download & Print

Use the dropdown icon on the Download button to choose between the PDF or Google Slides version of this resource. 

Because this resource includes an answer sheet, we recommend you print one copy of the entire file. Then, make photocopies of the blank worksheet for students to complete. 

To save paper, we suggest printing this 2-page worksheet double-sided. 

Additionally, project the worksheet onto a screen and work through it as a class by having students record their answers in their notebooks. 

Get more handy worksheets here!


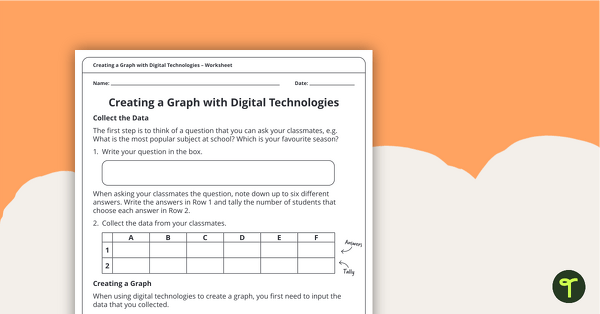
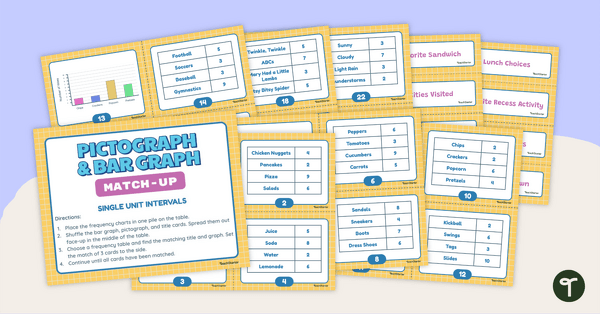
This resource was created by Cassandra Friesen, a teacher and Teach Starter collaborator. Don’t stop there! We’ve got more column graph and bar graph activities to reduce your lesson planning time:  

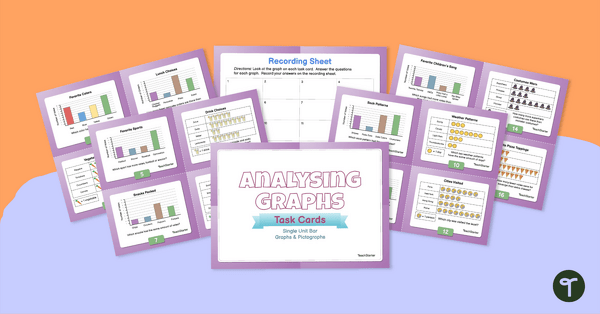
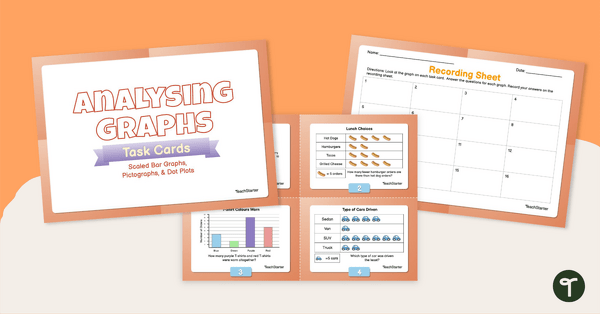
Image of Analysing Graphs — Scaled Bar Graphs, Pictographs, & Dot Plots —Task Cards

teaching resource

Analysing Graphs — Scaled Bar Graphs, Pictographs, & Dot Plots —Task Cards

Use data analysis skills to analyse scaled bar graphs, pictographs, and dot plots with this set of task cards.

Teach Starter Publishing7 pagesYear: 4
Image of Column Graphs – Teaching Presentation

teaching resource

Column Graphs – Teaching Presentation

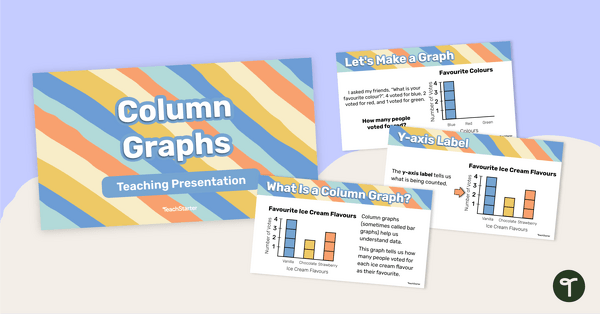
Learn all the features and how to construct a column graph with this 25-page teaching presentation.

Teach Starter Publishing25 pagesYears: 2 - 3

0 Comments

Write a review to help other teachers and parents like yourself. If you'd like to request a change to this resource, or report an error, select the corresponding tab above.

Log in to comment

You may also like