CCSS.MATH.CONTENT.4.MD.B.4
Make a line plot to display a data set of measurements in fractions of a unit (1/2, 1/4, 1/8). Solve problems involving addition and subtraction of fractions by using information presented in line plots. For example, from a line plot find and interpret the difference in length between the longest and shortest specimens in an insect collection.
- Free Plan
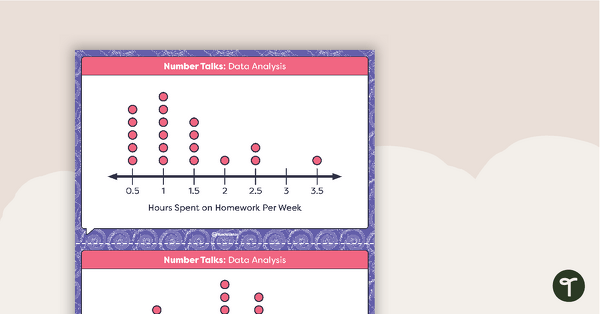
Number Talks - Data Analysis Task Cards
Build data analysis skills with this set of 26 task cards.
- Free Plan
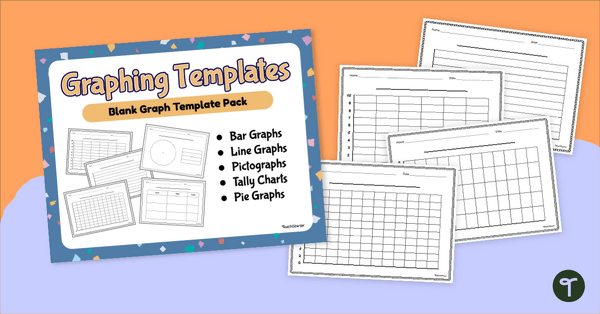
Blank Graph Template Pack
Construct your own graphs with a printable set of Blank Graph Templates.
- Plus Plan
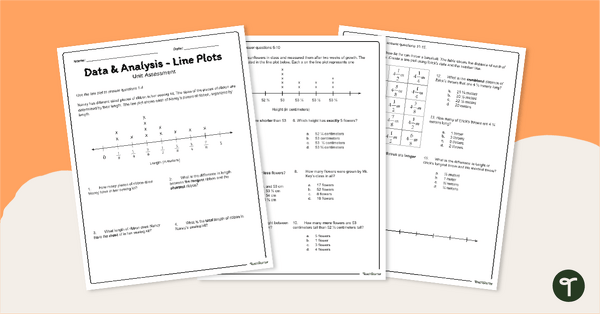
Dot Plots / Line Plots - 4th & 5th Grade Assessment
Assess student understanding of reading and creating line plots with a printable math test for 5th grade.
- Plus Plan
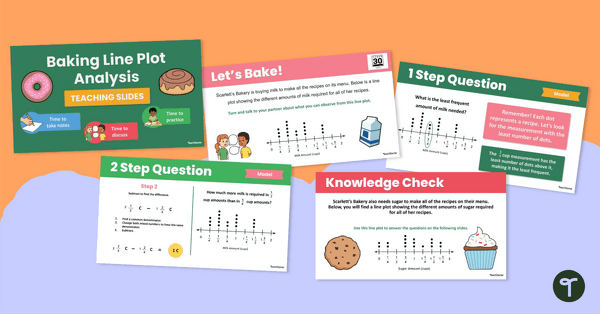
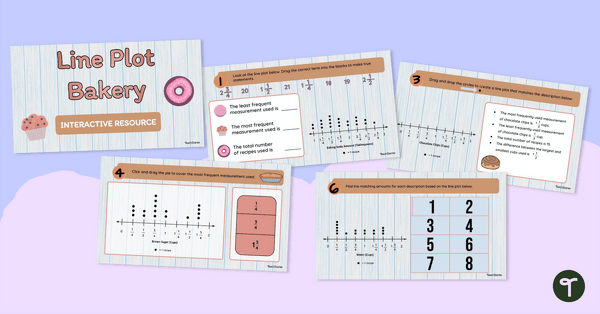
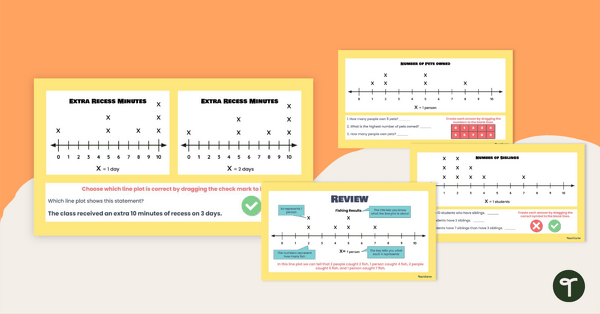
Baking Line Plot Analysis Teaching Slides
Explore the sweet side of graphs and data with this bakery-themed line plot resource, supporting your students' abilities to interpret line plots!
- Plus Plan
Dot Plot Bakery Interactive Activity
Strengthen dot plot skills with this bakery-themed interactive activity, designed to help students practice creating and analyzing dot graphs in a fun, structured way.
- Plus Plan
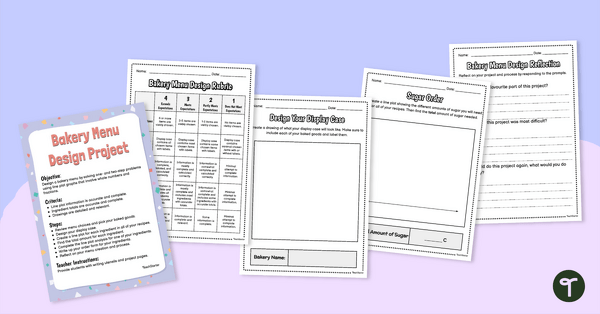
Line Plot Project: Bakery Menu Design
Make learning about math as sweet as your students' favorite treats with this project based learning line plots exercise!
- Plus Plan
Creating Line Plots (with Fractions and Decimals) Small Group Activity
Incorporate this small group activity into your math centers to reinforce students skills in interpreting data and displaying it as line plots.
- Plus Plan
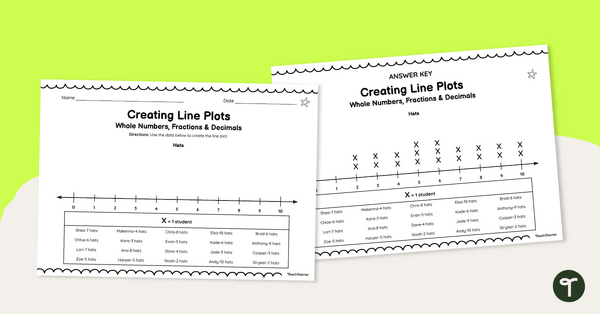
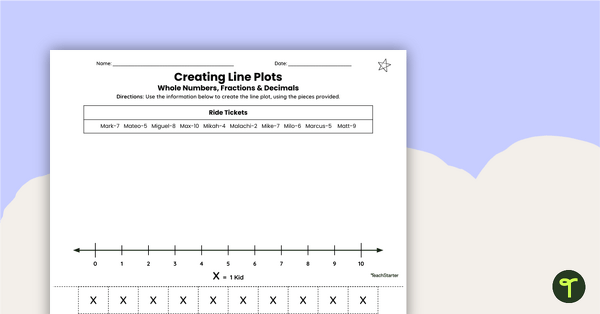
Creating Line Plots (With Whole Numbers, Fractions and Decimals) Worksheets
Help your students master data representation with this series of leveled worksheets for creating line plots.
- Plus Plan
Analyzing Line Plots Interactive Activity
Dive into data with your class using this engaging Analyzing Line Plots Interactive Activity!
- Plus Plan
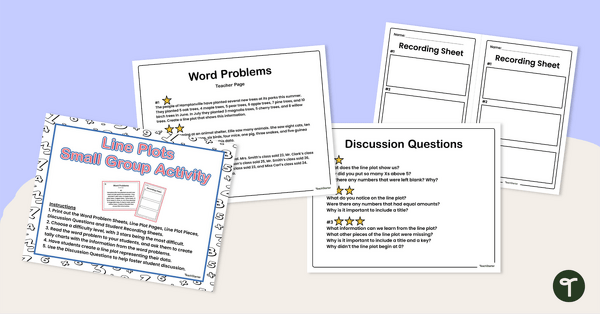
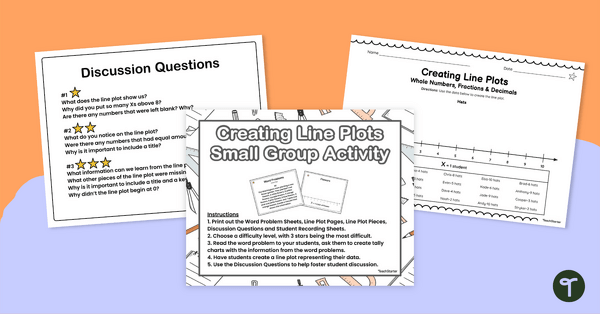
Creating Line Plots Small Group Activity
Enhance your students’ math skills through this small group activity where they’ll transfer word based data to create line plots.
- Plus Plan
Creating Line Plots (Fractions and Decimals) Cut and Paste Worksheets
Enable your students to create line plots to represent given data, using this hands-on cut and paste worksheet set.
- Plus Plan
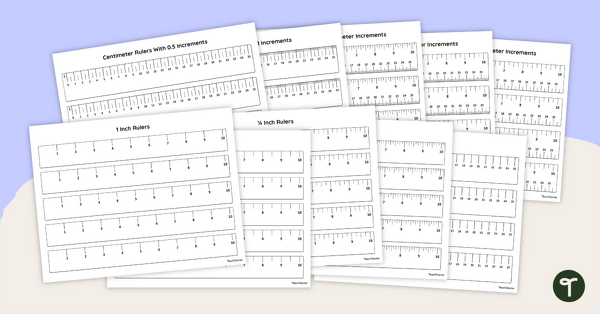
Printable Rulers for the Classroom
Excite your students about mastering precise measurements with these centimeter, inch, ½ inch, ¼ inch and ⅛ inch printable rulers!
- Plus Plan
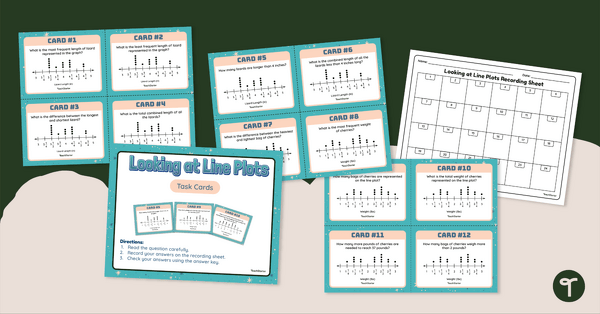
Looking at Line Plots With Fractions Task Cards
Challenge your students to analyze a line plot with fractions and answer questions with this this set of 24 task cards.
- Plus Plan

Grade 4 Daily Warm-Up – PowerPoint 1
A 70-slide PowerPoint presentation containing a variety of quick warm-up activities.
- Plus Plan
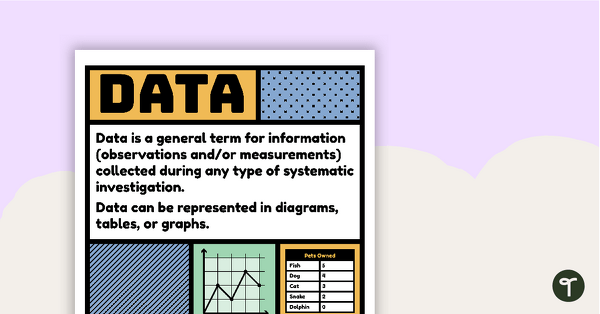
Data Vocabulary Poster
A poster that explains the concept of data and lists associated vocabulary.
- Plus Plan
Types of Graphs Posters and Worksheets
A collection of posters displaying the different types of graphs along with matching worksheets to assist students with laying out graphs on the page.
- Plus Plan
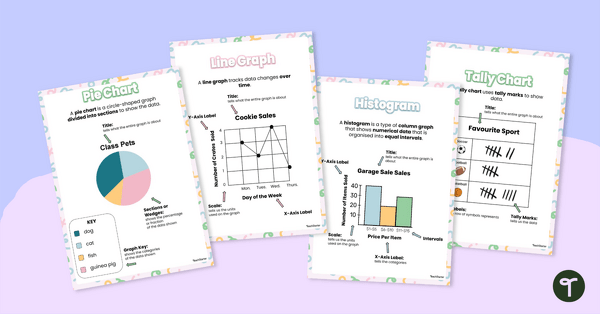
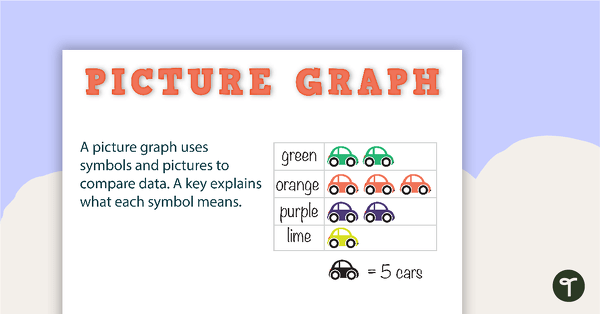
Types of Graphs Posters
This colorful and easy-to-digest visual display shows students the varying data displays they will encounter in their elementary math lessons.