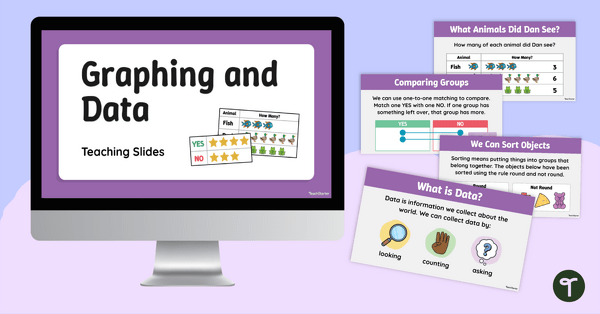
Teach early data and graphing skills with these engaging graphing and data teaching slides, designed to help Foundation students collect, sort, organise and compare real-world data.
Graphing and Data Teaching Slides for Foundation Maths
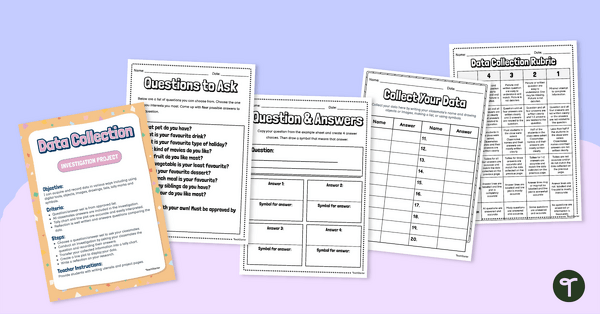
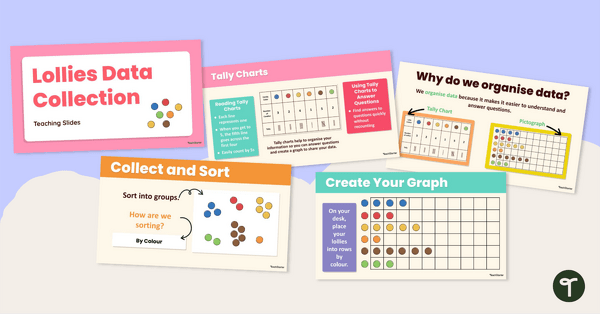
Understanding data begins with helping students ask questions, collect information and organise it in meaningful ways. These graphing and data teaching slides guide young learners through the process of sorting objects, asking simple investigative questions, collecting data and comparing results.
Using clear visuals, discussion prompts and hands-on examples, students learn how to create and interpret simple data displays, compare groups and use mathematical language such as more, fewer, most and fewest. The resource also includes opportunities for students to collect real class data, create sticker charts and participate in interactive graphing activities.
Topics covered include:
- Sorting objects into categories
- Collecting data through questions and surveys
- Organising data into simple charts
- Comparing and interpreting data
- Using graphing vocabulary to discuss results
- Reading and creating sticker charts
Once students complete the lessons, they will be able to collect, sort and compare data from familiar situations and explain what their data shows.
Flexible Ways to Use These Data and Graphing Slides
These data and graphing slides can be used throughout your maths block in a variety of ways, including:
- Whole-Class Investigations – Guide students through class surveys and model how to collect, organise and compare data together.
- Interactive Whiteboard Lessons – Use the visual examples and movable elements to encourage discussion and participation during explicit teaching.
- Cross-Curricular Data Projects – Collect data connected to classroom routines, favourite activities, wellbeing check-ins or stories and use the slides to analyse the results.
Download These Foundation Graphing Teaching Slides
This resource is available as an editable PowerPoint file and a Google Slides version. Use the Download button above to access your preferred file type. Please note that you will be prompted to make your own copy of the Google Slides before editing.
This resource was created by Lindsey Phillips, a teacher and a Teach Starter collaborator.
More Graphing and Data Resources
Looking for more graphing and data activities? Browse the related resources below!
teaching resource
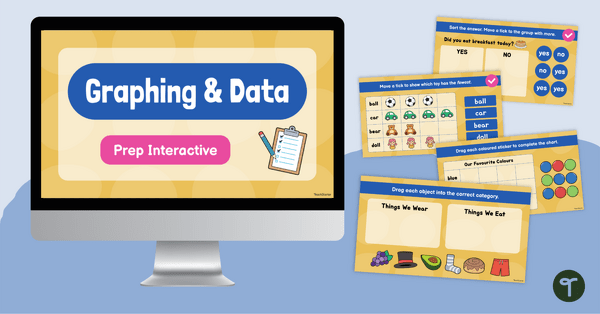
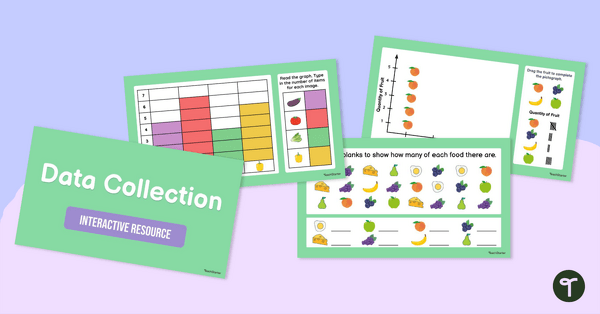
Collecting, Comparing and Sorting Data — Digital Interactive
Explore collecting, sorting and comparing data with this engaging interactive resource, designed to help students organise information.
teaching resource
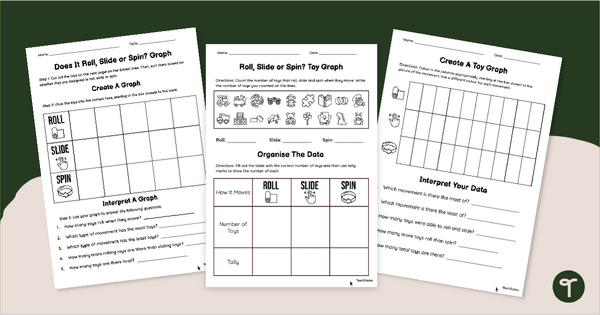
How Does It Move? Toy Graphing Worksheets
Explore motion and mathematics with engaging Toy Graphing Worksheets.
teaching resource
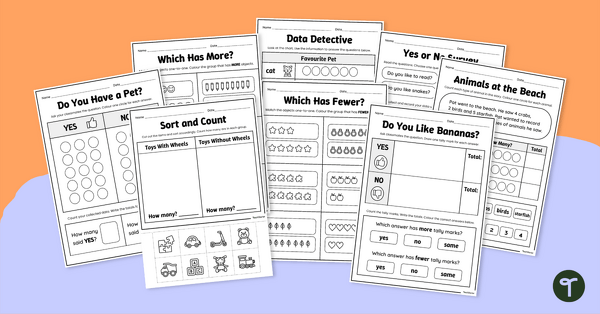
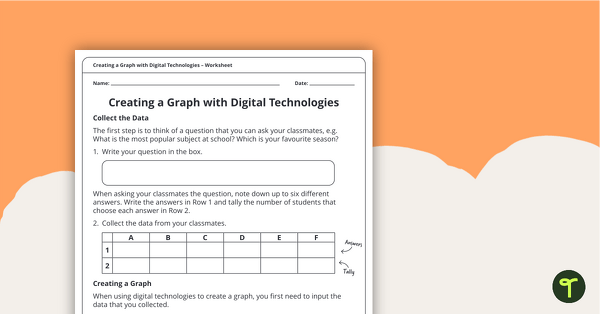
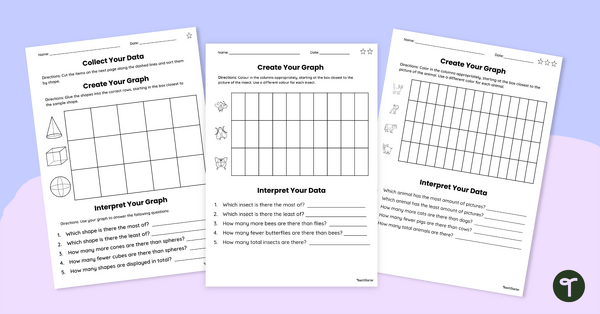
Collect, Sort and Compare Data Worksheet Pack
Build early data and graphing skills with this engaging worksheet pack that helps students collect, sort and compare data.

0 Comments
Write a review to help other teachers and parents like yourself. If you'd like to request a change to this resource, or report an error, select the corresponding tab above.