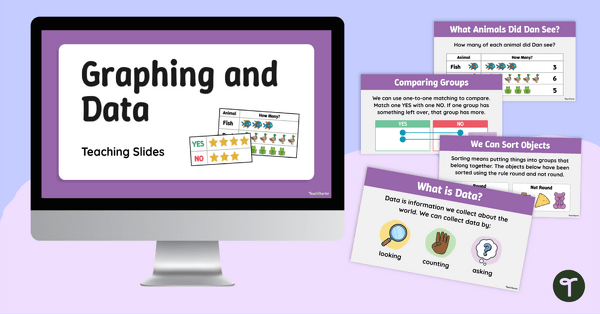
Teach foundational data skills with these engaging graphing and data teaching slides, designed to help kindergarten students sort objects, classify data, and compare groups with confidence.
Graphing and Data Teaching Slides for Kindergarten
Sorting, classifying, and comparing data are important early math skills. These graphing and data teaching slides introduce students to data through hands-on examples, simple surveys, and visual representations that make abstract concepts easy to understand.
Through interactive discussions and guided practice, students learn how to sort objects into categories, collect and organize data, answer yes-or-no survey questions, create sticker charts, and compare groups using mathematical language such as more, fewer, most, and fewest.
The lessons included in this resource support students as they learn to:
- Sort objects into categories
- Collect and organize class survey data
- Compare groups and quantities
- Identify which category has more or fewer
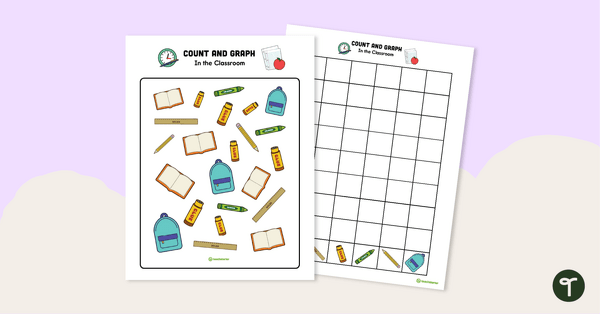
- Read and create simple sticker charts
- Discuss and interpret data using mathematical vocabulary
By the end of the unit, students will be able to classify objects, count and compare categories, and use data to answer simple questions.
Flexible Ways to Use These Data and Graphing Slides
These data and graphing slides can be used throughout your math lessons in a variety of ways, including:
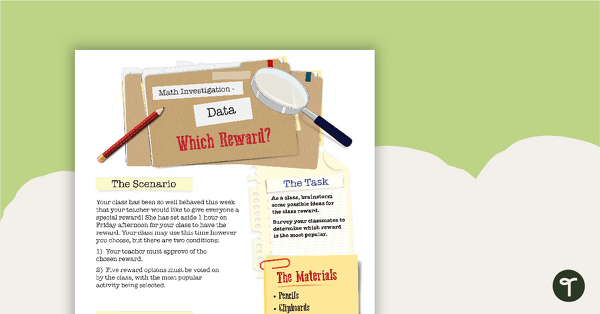
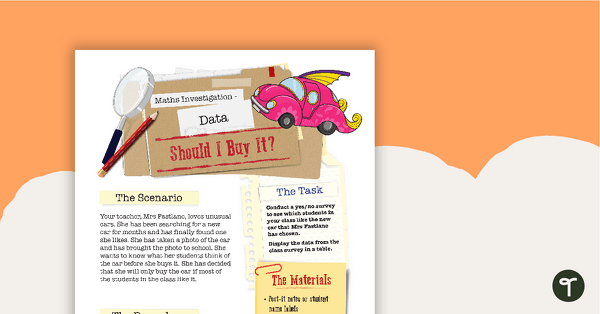
- Class Survey Investigations – Have students answer yes-or-no questions and organize the results into sticker charts for discussion.
- Hands-On Sorting Activities – Use classroom objects, toys, or manipulatives to sort items into categories before connecting the activity to the slides.
- Interactive Data Talks – Display graphs and charts and encourage students to identify which groups have more, fewer, most, or fewest.
Download These Kindergarten Graphing Teaching Slides
This resource is available in Microsoft PowerPoint and Google Slides formats, making it easy to present lessons, customize activities, and adapt content to meet the needs of your students. Use the Download button above to access your preferred file type. Please note that you will be prompted to make your own copy of the Google Slides version before editing.
This resource was created by Lindsey Phillips, a teacher from Michigan and a Teach Starter collaborator.
More Graphing and Data Teaching Slides and Activities
Explore more graphing, sorting, and data activities to help students build confidence with collecting, organizing, and interpreting information.
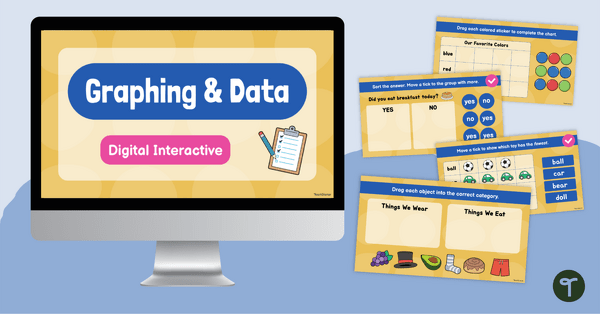
teaching resource
Classifying and Counting Data — Digital Interactive
Support early data and graphing skills with this interactive digital resource that helps students sort, classify, compare, and organize information.
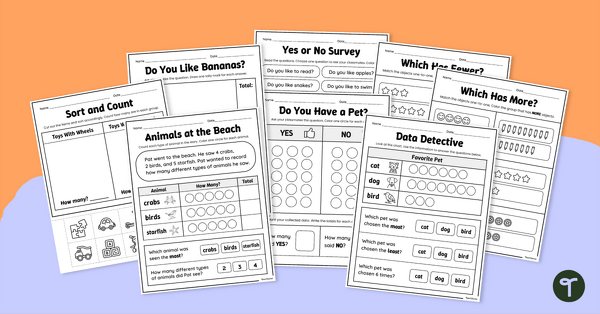
teaching resource
Collect, Sort, and Compare Data Worksheet Pack
Introduce young learners to data and graphing through this engaging worksheet pack.
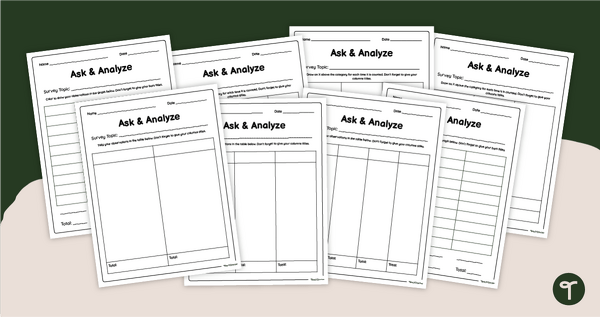
teaching resource
Data Collection Worksheets - Blank Survey Template
Organize student survey data with a set of printable survey data collection worksheets.

0 Comments
Write a review to help other teachers and parents like yourself. If you'd like to request a change to this resource, or report an error, select the corresponding tab above.