CCSS.MATH.CONTENT.5.MD.B.2
Make a line plot to display a data set of measurements in fractions of a unit (1/2, 1/4, 1/8). Use operations on fractions for this grade to solve problems involving information presented in line plots. For example, given different measurements of liquid in identical beakers, find the amount of liquid each beaker would contain if the total amount in all the beakers were redistributed equally.
- Free Plan
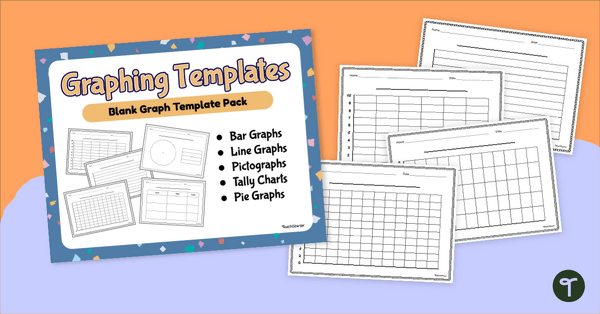
Blank Graph Template Pack
Construct your own graphs with a printable set of Blank Graph Templates.
- Plus Plan
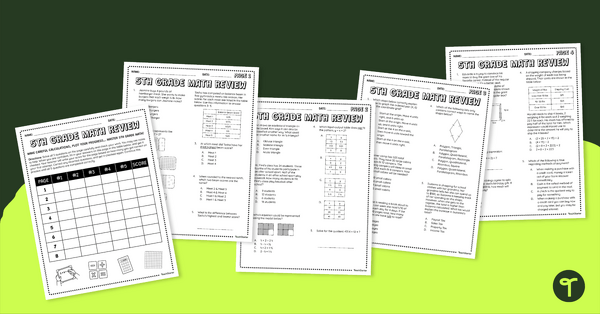
5th Grade Math Review – Test Prep Packet
Encourage your students to work through 8 pages of 5th-grade math problems while charting their progress to measure their success.
- Plus Plan
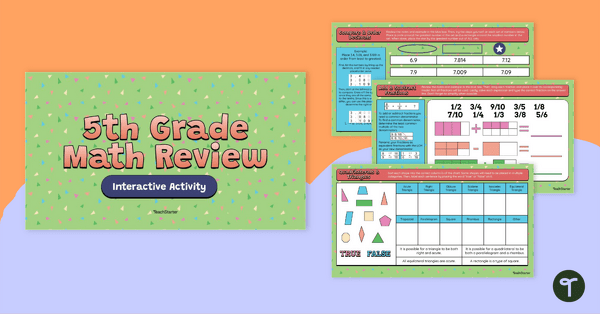
5th Grade Math Review – Google Slides Interactive Activity
Review important 5th-grade math standards with a student-led interactive activity that covers 12 different mathematical concepts.
- Free Plan
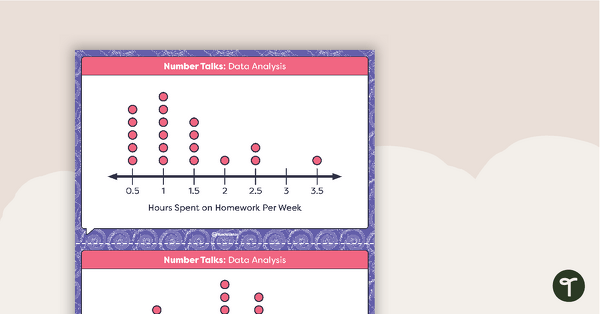
Number Talks - Data Analysis Task Cards
Build data analysis skills with this set of 26 task cards.
- Plus Plan
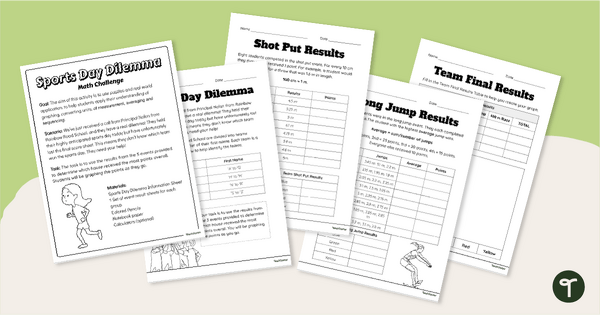
Sports Day Dilemma - Metric Conversions Math Task
Engage students with a real-world application of measurement conversions with Sports Day Dilemma, a metric conversion math task!
- Plus Plan
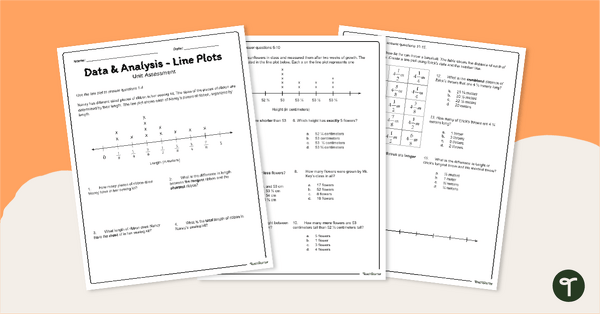
Dot Plots / Line Plots - 4th & 5th Grade Assessment
Assess student understanding of reading and creating line plots with a printable math test for 5th grade.
- Plus Plan
Creating Line Plots (with Fractions and Decimals) Small Group Activity
Incorporate this small group activity into your math centers to reinforce students skills in interpreting data and displaying it as line plots.
- Plus Plan
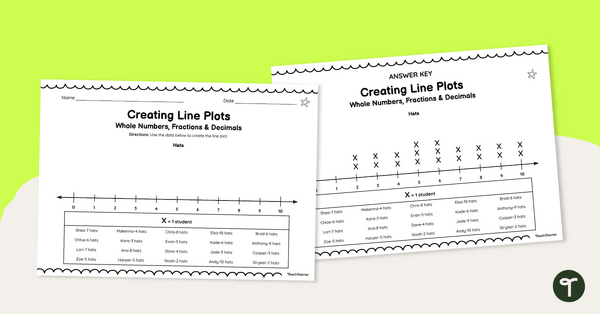
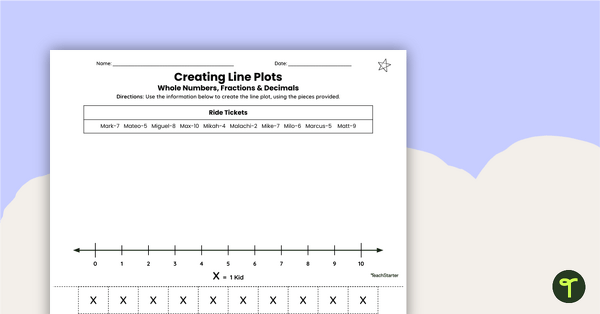
Creating Line Plots (With Whole Numbers, Fractions and Decimals) Worksheets
Help your students master data representation with this series of leveled worksheets for creating line plots.
- Plus Plan
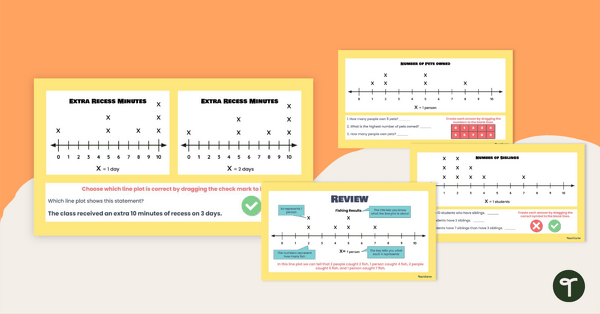
Analyzing Line Plots Interactive Activity
Dive into data with your class using this engaging Analyzing Line Plots Interactive Activity!
- Plus Plan
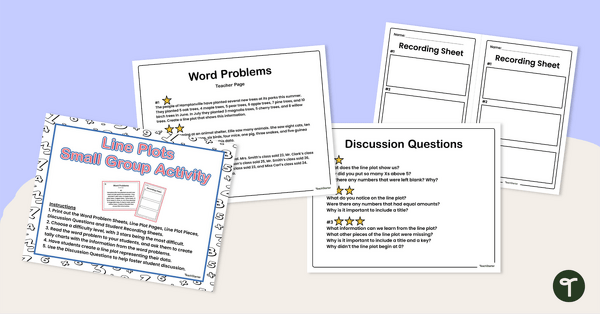
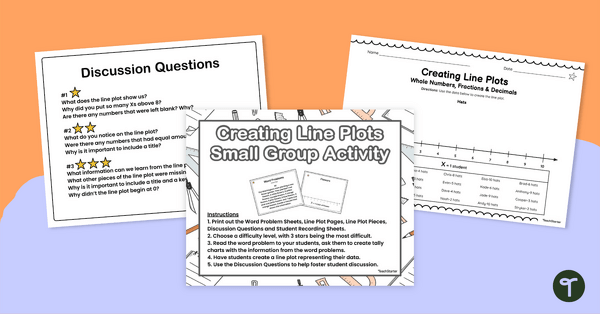
Creating Line Plots Small Group Activity
Enhance your students’ math skills through this small group activity where they’ll transfer word based data to create line plots.
- Plus Plan
Creating Line Plots (Fractions and Decimals) Cut and Paste Worksheets
Enable your students to create line plots to represent given data, using this hands-on cut and paste worksheet set.
- Plus Plan
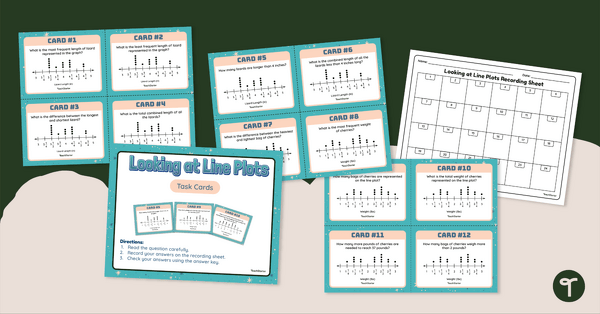
Looking at Line Plots With Fractions Task Cards
Challenge your students to analyze a line plot with fractions and answer questions with this this set of 24 task cards.
- Plus Plan
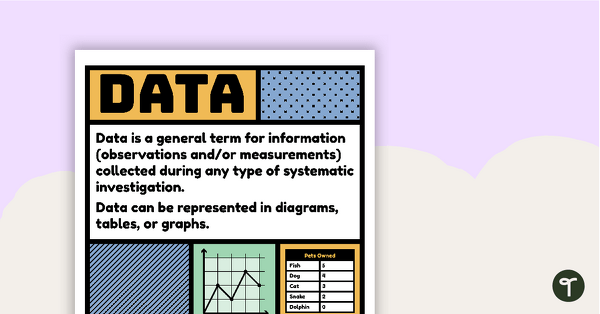
Data Vocabulary Poster
A poster that explains the concept of data and lists associated vocabulary.