Use this fun cut-and-paste worksheet to consolidate student understanding of pictographs, and encourage them to practise their fine motor skills.
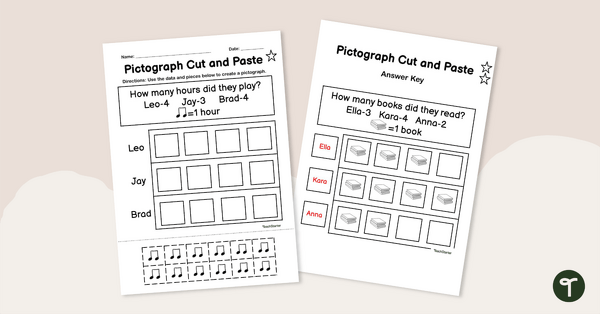
Pictograph Fun! Create Pictographs to Match the Data!
This levelled worksheet requires students to read a simple set of data and create a pictograph to represent the data. Included are 3 sheets increasing in complexity (look for the stars to see which one’s which: one star is the lowest level and three stars are the highest level of difficulty).
Students will cut and paste pictures onto the blank graphs to represent the correct quantity.
An answer key is included with your download to make marking fast and easy!
Tips for Differentiation + Scaffolding
In addition to individual student work time, use this worksheet as a:
- guided group
- lesson exit ticket
- fast finisher activity
- homework assignment
- whole-class review (via smartboard)
Easily Download & Print
Use the dropdown icon on the Download button to choose between the PDF or Google Slides version of this resource.
Because this resource includes an answer sheet, we recommend you print one copy of the entire file. Then, make photocopies of the blank worksheets for students to complete.
Turn this teaching resource into a sustainable activity by printing on cardboard and slipping it into a write-and-wipe sleeve. Students can record their answers with a whiteboard marker, then erase and reuse.
Additionally, project the worksheet onto a screen and work through it as a class by having students record their answers in their notebooks.
This resource was created by Brittany Kellogg, a Teach Starter Collaborator.
Don’t stop there! We’ve got more activities and resources that cut down on lesson planning time:
[resource:4963868][resource:4961213][resource:4963853]

0 Comments
Write a review to help other teachers and parents like yourself. If you'd like to request a change to this resource, or report an error, select the corresponding tab above.