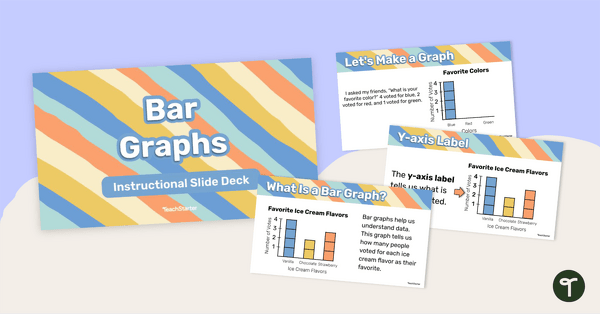
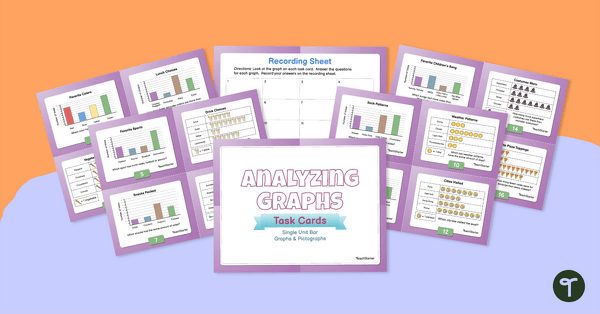
Learn about the features and how to create a bar graph with this 25-page instructional slide deck.
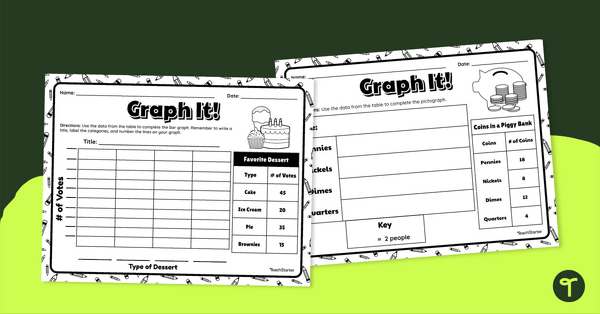
What are the Parts of a Bar Graph?
The parts of a bar graph include:
- a title
- a labeled y-axis (the units being measured)
- a labeled x-axis (the categories of data collected)
- a scale
- columns or bars
This instructional slide deck walks through the process of displaying data using a bar graph. Students will learn what each part of the bar graph represents and then will work as a class through the process of creating their own.
It is suggested that you draw the bar graph on a whiteboard or document camera while using the presentation so that students see the process of constructing the bar graph.
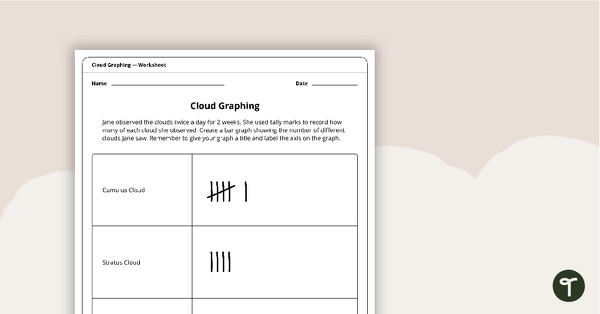
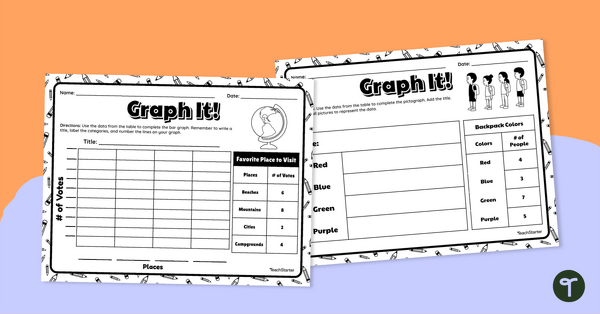
Through this activity, students will learn how to create displays using simple bar graphs.
Easily Download This Resource
This resource downloads as an editable Google Slides presentation.
This resource was created by Kendall Britnell, a teacher in Colorado and Teach Starter Collaborator.


0 Comments
Write a review to help other teachers and parents like yourself. If you'd like to request a change to this resource, or report an error, select the corresponding tab above.