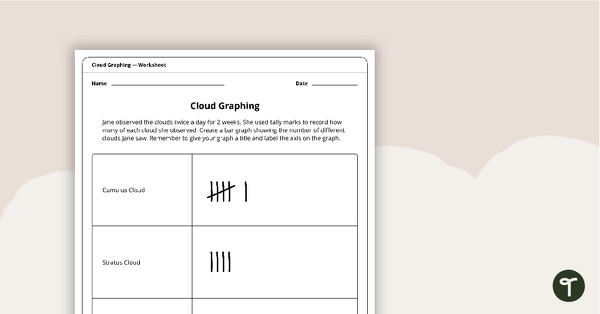
A worksheet to use when graphing cloud observations.
Use this activity when learning about graphs and data, as well as the different types of clouds.
Students are required to place the information provided on the graph template.
Updated: 08 May 2023
A worksheet to use when graphing cloud observations.
Non-Editable: PDF
Pages: 2 Pages
Grades: 1 - 3
Organize, represent, and interpret data with up to three categories; ask and answer questions about the total number of data points, how many in each category, and how many more or less are in one category than in another.
Draw a picture graph and a bar graph (with single-unit scale) to represent a data set with up to four categories. Solve simple put-together, take-apart, and compare problems1 using information presented in a bar graph.
Draw a scaled picture graph and a scaled bar graph to represent a data set with several categories. Solve one- and two-step "how many more" and "how many less" problems using information presented in scaled bar graphs. For example, draw a bar graph i...
Use data to create picture and bar-type graphs; and
Observe, describe, and illustrate the Sun, Moon, stars, and objects in the sky such as clouds.
A worksheet to use when graphing cloud observations.
Use this activity when learning about graphs and data, as well as the different types of clouds.
Students are required to place the information provided on the graph template.
Organize, represent, and interpret data with up to three categories; ask and answer questions about the total number of data points, how many in each category, and how many more or less are in one category than in another.
Draw a picture graph and a bar graph (with single-unit scale) to represent a data set with up to four categories. Solve simple put-together, take-apart, and compare problems1 using information presented in a bar graph.
Draw a scaled picture graph and a scaled bar graph to represent a data set with several categories. Solve one- and two-step "how many more" and "how many less" problems using information presented in scaled bar graphs. For example, draw a bar graph i...
Use data to create picture and bar-type graphs; and
Observe, describe, and illustrate the Sun, Moon, stars, and objects in the sky such as clouds.

We create premium quality, downloadable teaching resources for primary/elementary school teachers that make classrooms buzz!
Would you like something changed or customised on this resource? While our team makes every effort to complete change suggestions, we can't guarantee that every change will be completed.
Did you spot an error on this resource? Please let us know and we will fix it shortly.
Are you having trouble downloading or viewing this resource? Please try the following steps:
If you are still having difficulty, please visit the Teach Starter Help Desk or contact us .
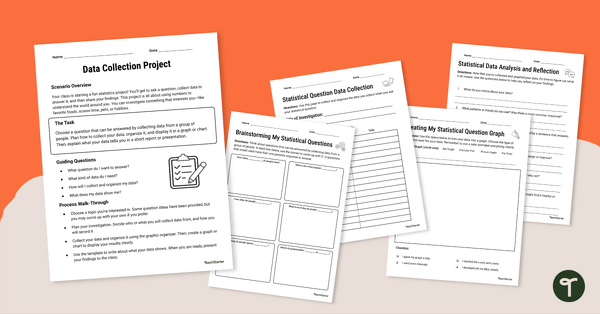
Complete this data collection project with your students to give them practice developing a statistical question, collecting data, and displaying the results.
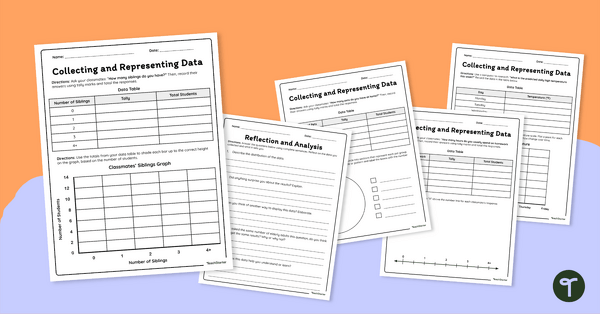
Download our collecting and representing data worksheet set to get your students collecting, organizing, and displaying data.
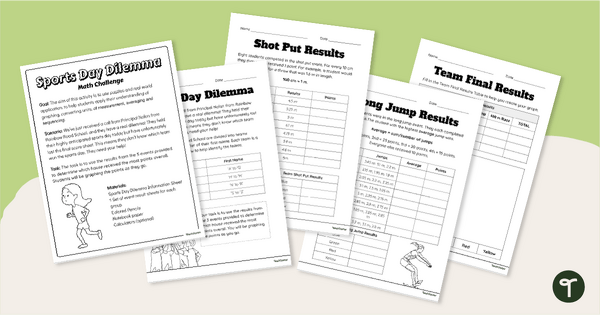
Engage students with a real-world application of measurement conversions with Sports Day Dilemma, a metric conversion math task!
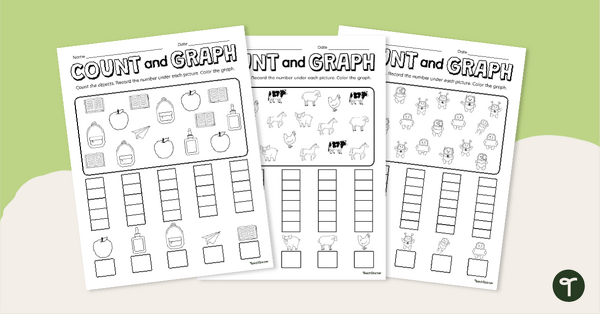
Explore counting and graphing skills with this set of three worksheets.
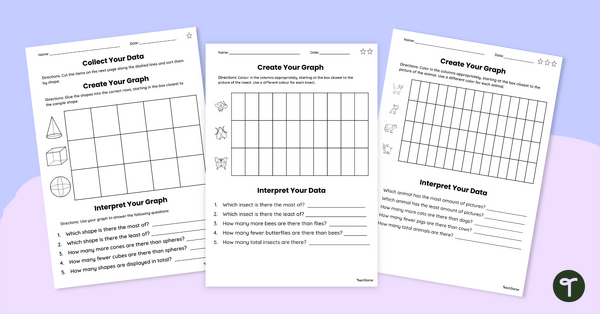
Use this set of differentiated graphs worksheets to assess your students’ understanding of how data is collected, organized and presented.
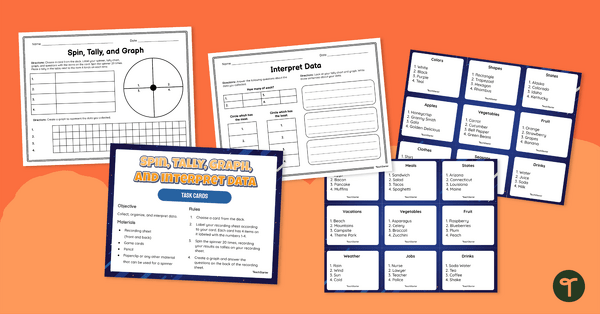
Guide your students to collect data, make tally marks, create a bar graph and analyze data with this math activity designed for 1st and 2nd-grade students.
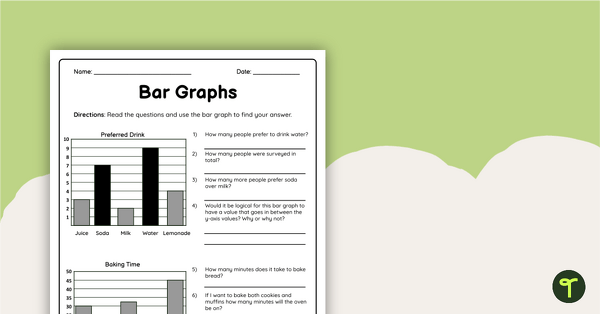
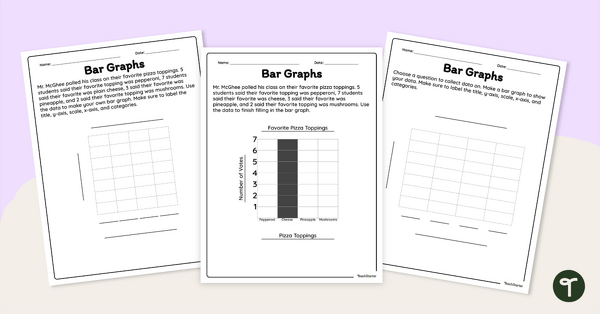
Use this double-sided bar graphs worksheet to check your students’ understanding of interpreting and drawing bar graphs.
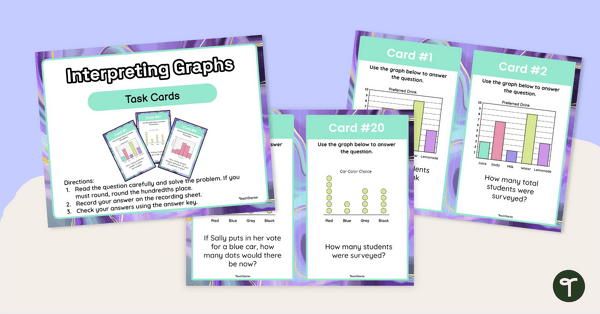
Use this set of task cards students to practice interpreting bar graphs, histograms and line plots.
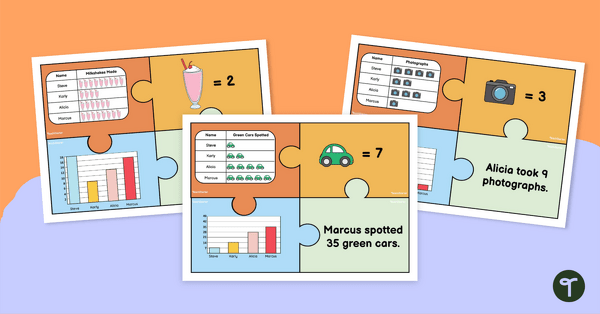
Practice reading and interpreting pictographs with these fun puzzles which require students to match pictographs with other data displays with matching data.
Interpret data and create bar graphs with this worksheet.
0 Comments
Write a review to help other teachers and parents like yourself. If you'd like to request a change to this resource, or report an error, select the corresponding tab above.