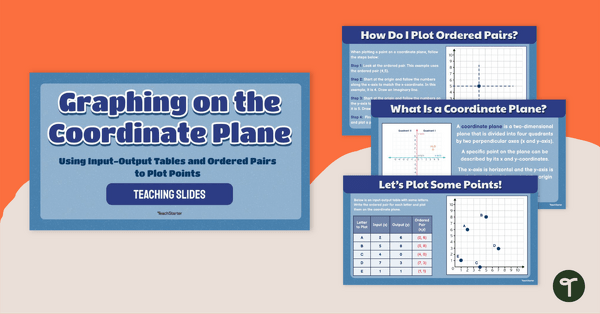
Teach your students how to plot points on a graph using ordered pairs from input-output tables with this set of teaching slides.
What Is a Coordinate Plane?
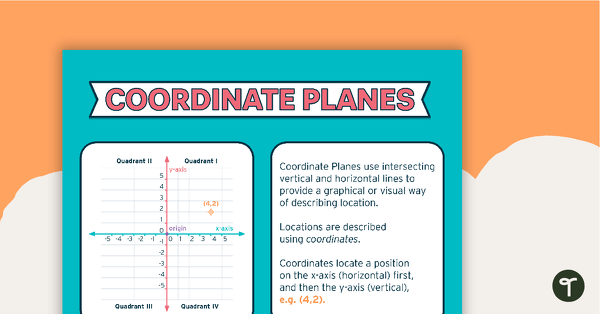
A coordinate plane, also known as a Cartesian plane or a coordinate grid, is a two-dimensional plane that is used to plot and locate points using a pair of numbers called coordinates. It consists of two perpendicular number lines, typically labeled the x-axis and the y-axis, which intersect at a common point called the origin.
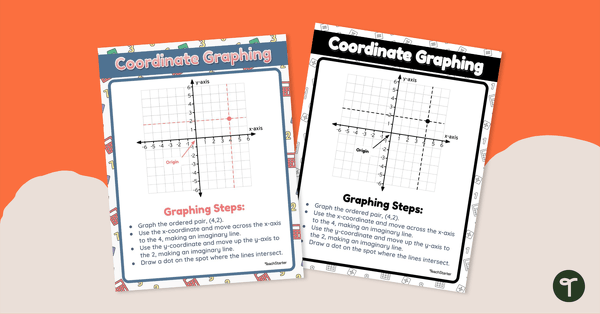
How to Plot Points on a Graph
To plot a point on a coordinate grid, you can teach your students to follow these steps:
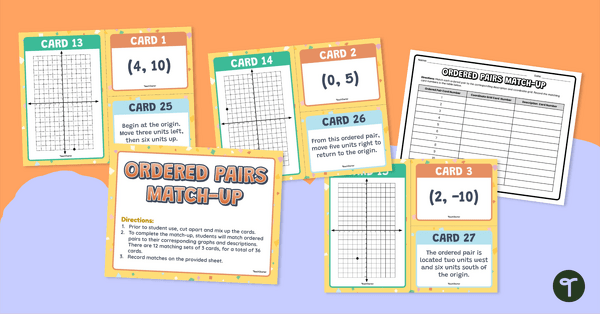
- Identify the coordinates of the point. Coordinates consist of an x-value (horizontal) and a y-value (vertical). For example, let’s say you want to plot the point (2, 3).
- Locate the x-axis and the y-axis on the grid.
- Find the x-value of the point you want to plot (in this case, 2) on the x-axis and move vertically until you intersect with the line that represents the y-value (in this case, 3) on the y-axis.
- Mark the intersection point with a dot or a small circle to represent the plotted point.
Remember that the scale and intervals on the axes determine the spacing between points. The grid may have labeled intervals, or you can estimate the placement based on the scale.
Use Our Coordinate Grid Slide Deck in Your Classroom!
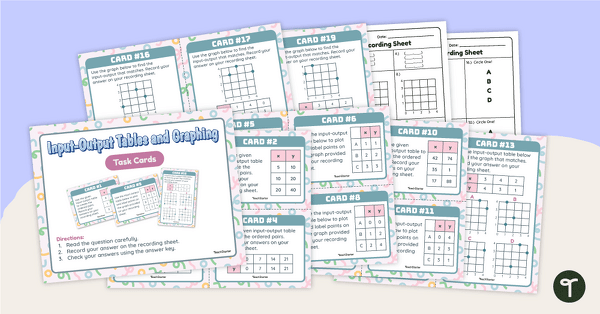
Teach Starter has put together a set of teaching slides that you can use with your students when teaching them about ordered pairs and plotting points. This 19-slide teaching presentation guides students through different concepts such as:
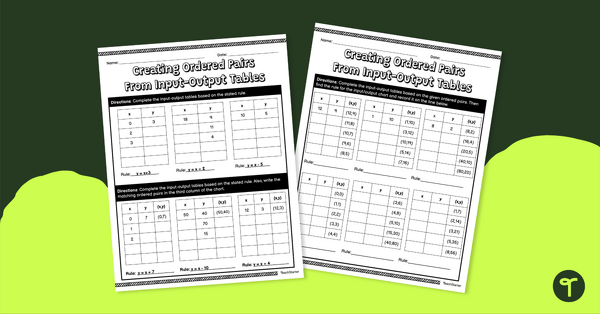
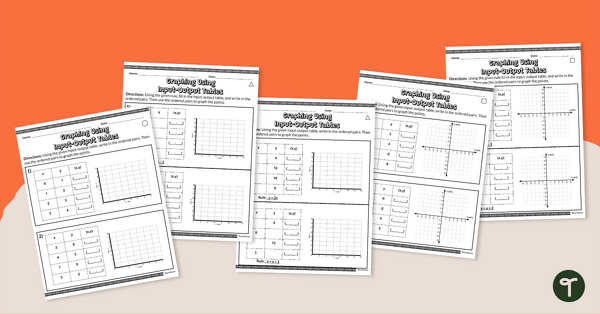
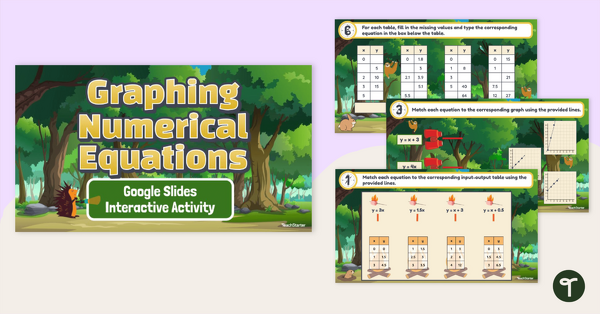
- Input-output tables
- Finding a rule
- Creating ordered pairs
- Quadrants on the coordinate plane
- Plotting points
And more!
Easily Prepare This Resource for Your Students
Use the Download button to access this resource’s editable Google Slides version.
This resource was created by Cassandra Friesen, a teacher in Colorado and a Teach Starter Collaborator.
Don’t stop there! We’ve got more activities and resources that cut down on lesson planning time:
[resource:4849533] [resource:4849455] [resource:4895202]

0 Comments
Write a review to help other teachers and parents like yourself. If you'd like to request a change to this resource, or report an error, select the corresponding tab above.