Math 2.10(A)
explain that the length of a bar in a bar graph or the number of pictures in a pictograph represents the number of data points for a given category;
- Free Plan
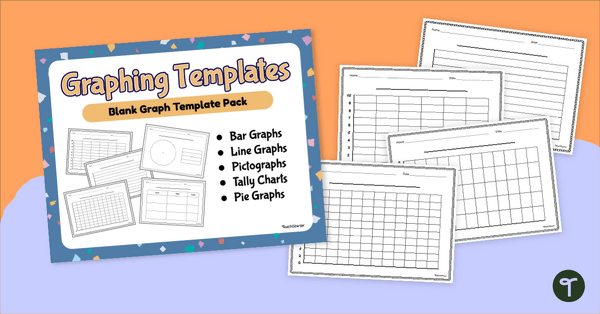
Blank Graph Template Pack
Construct your own graphs with a printable set of Blank Graph Templates.
- Plus Plan
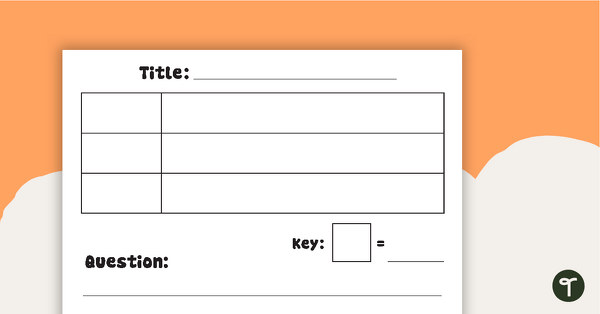
Picture Graph Templates
A set of blank picture graph templates for students to represent data.
- Plus Plan
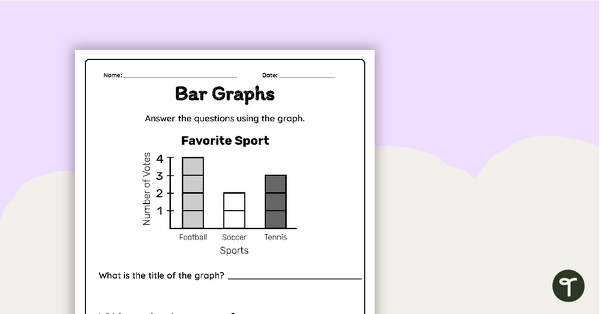
Interpreting a Bar Graph – Worksheet
Interpret information from a bar graph and answer questions with this worksheet.
- Plus Plan
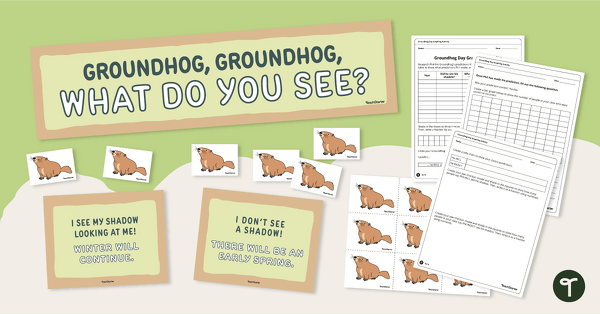
Groundhog Day Graphing Prediction Display and Worksheet
Graph the likelihood that Punxsutawney Phil will see his shadow this year by creating a data chart on our Groundhog Day prediction worksheet.
- Plus Plan
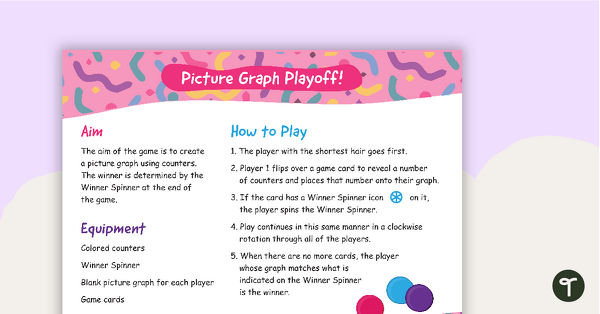
Picture Graph Playoff – Math Game
A fun game for students to practice gathering and representing data in a picture graph.
- Plus Plan
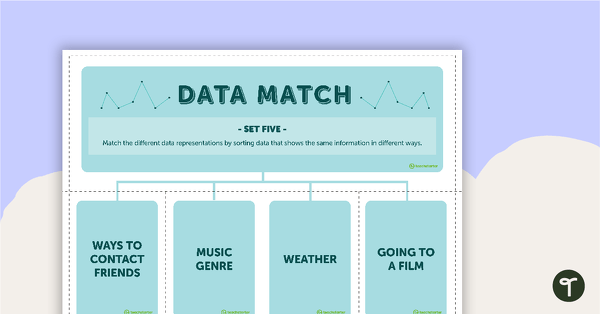
Data Match-Up Cards (Set 5)
A match-up activity for students to use when exploring data.
- Plus Plan
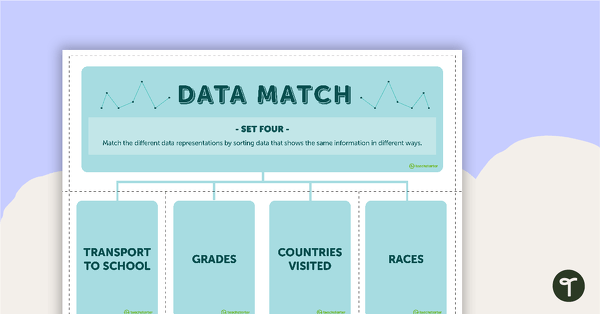
Data Match-Up Cards (Set 4)
A match-up activity for students to use when exploring data.
- Plus Plan
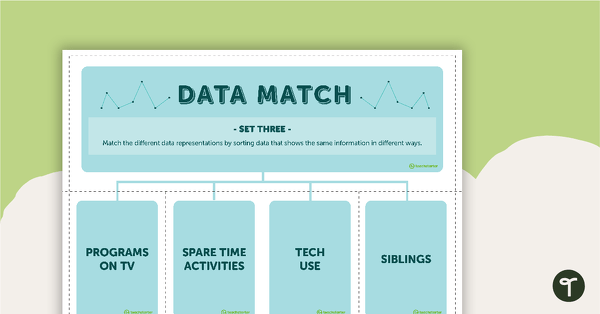
Data Match-Up Cards (Set 3)
A match-up activity for students to use when exploring data.
- Plus Plan
Data Match Game Cards (Set 2)
A match up game for students to use when exploring data.
- Plus Plan

Data Match Game Cards (Set 1)
A match-up game for students to use when exploring data.
- Plus Plan

Data Match-Up Cards Resource Pack
A match-up activity resource pack for students to use when exploring data.