Math 2.10(D)
draw conclusions and make predictions from information in a graph.
- Free Plan
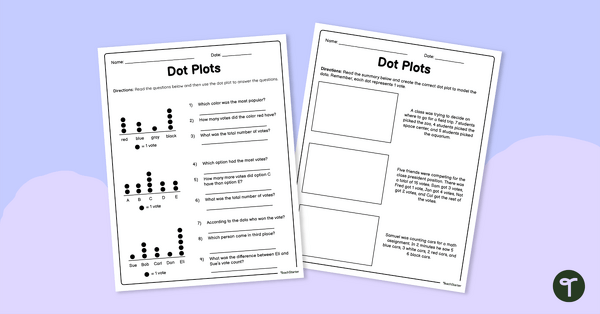
Dot Plot Worksheet for 2nd Grade
Practice analyzing and creating single-unit dot plots with this free math worksheet for 2nd-grade students.
- Plus Plan
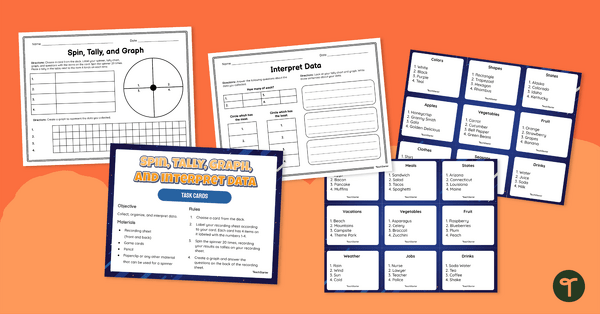
Spin, Tally, Graph and Interpret Data – Task Card Activity
Guide your students to collect data, make tally marks, create a bar graph and analyze data with this math activity designed for 1st and 2nd-grade students.
- Plus Plan
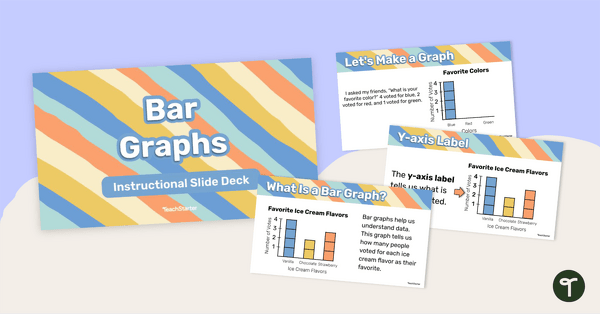
Bar Graphs – Instructional Slide Deck
Learn about the features and how to create a bar graph with this 25-page instructional slide deck.
- Plus Plan
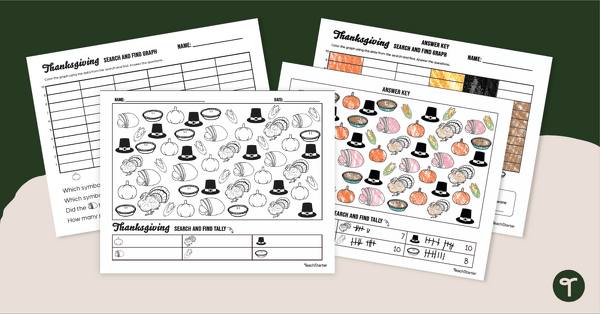
Thanksgiving Graphing Activity for Kindergarten
Practice counting and graphing with a fun Thanksgiving Graphing Activity for kindergarten.
- Plus Plan
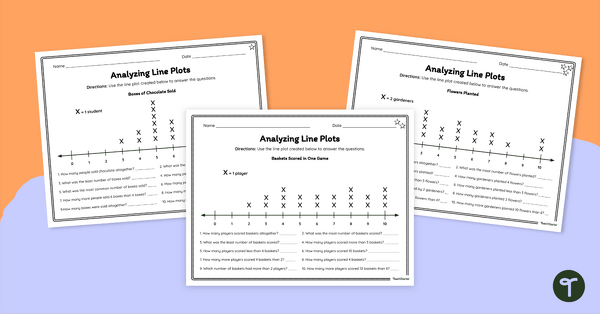
Analyzing Line Plots – Differentiated Worksheets
Empower your students to become proficient data interpreters with this set of differentiated line plot worksheets.
- Plus Plan
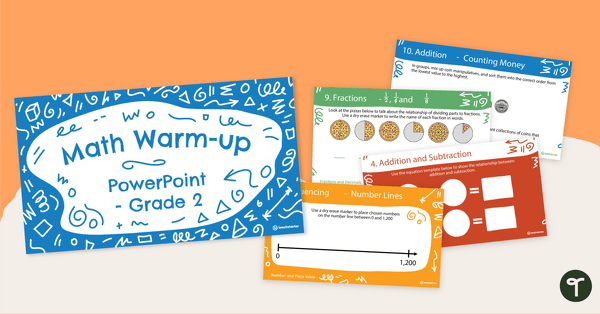
Math Warm-Ups Interactive PowerPoint - Grade 2
A PowerPoint providing a series of warm-up activities for Grade 2 students across the mathematics curriculum.
- Plus Plan
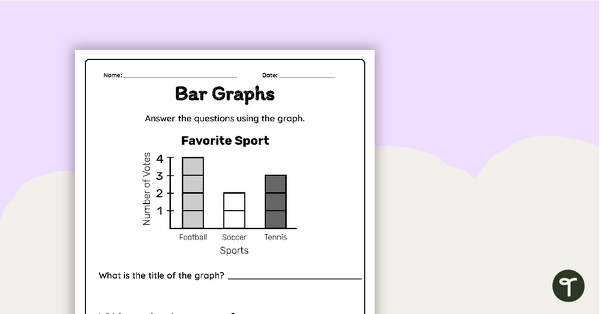
Interpreting a Bar Graph – Worksheet
Interpret information from a bar graph and answer questions with this worksheet.
- Plus Plan
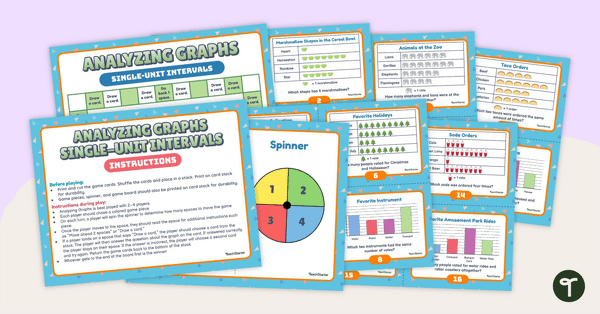
Analyzing Graphs (Single-Unit Intervals) – Board Game
Sharpen student data analysis skills when solving problems with information presented in a single-unit picture graph and bar graph with this board game.
- Plus Plan
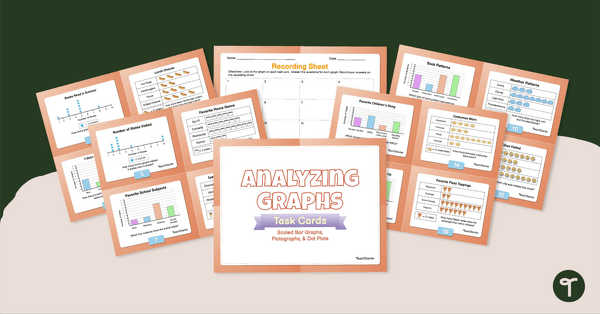
Analyzing Graphs — Scaled Bar Graphs, Pictographs, & Dot Plots —Task Cards
Use data analysis skills to analyze scaled bar graphs, pictographs, and dot plots with this set of task cards.
- Plus Plan
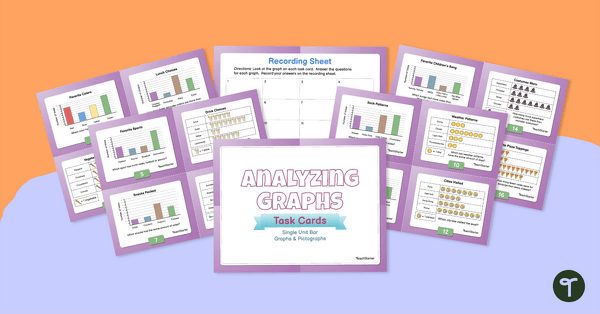
Analyzing Graphs – Single-Unit Bar Graphs & Pictographs – Task Cards
Use data analysis skills to analyze bar graphs and pictographs with this set of task cards.
- Plus Plan
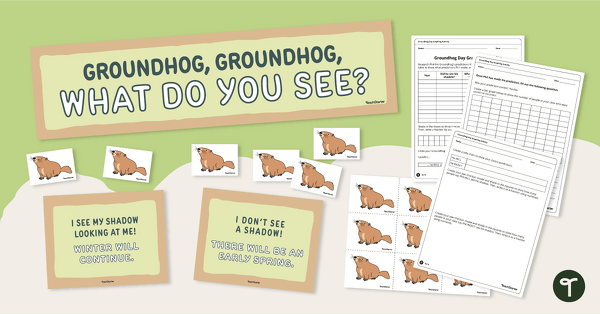
Groundhog Day Graphing Prediction Display and Worksheet
Graph the likelihood that Punxsutawney Phil will see his shadow this year by creating a data chart on our Groundhog Day prediction worksheet.
- Plus Plan
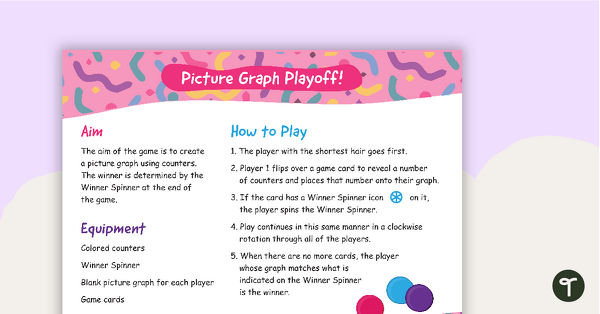
Picture Graph Playoff – Math Game
A fun game for students to practice gathering and representing data in a picture graph.
- Plus Plan
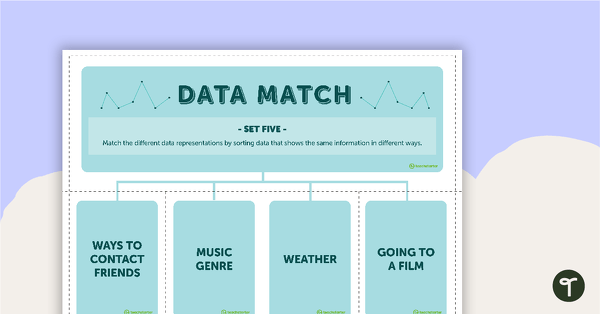
Data Match-Up Cards (Set 5)
A match-up activity for students to use when exploring data.
- Plus Plan
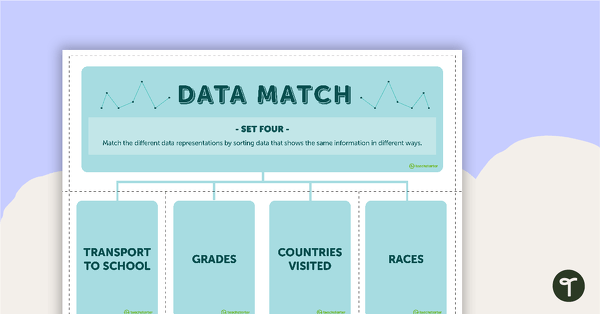
Data Match-Up Cards (Set 4)
A match-up activity for students to use when exploring data.
- Plus Plan
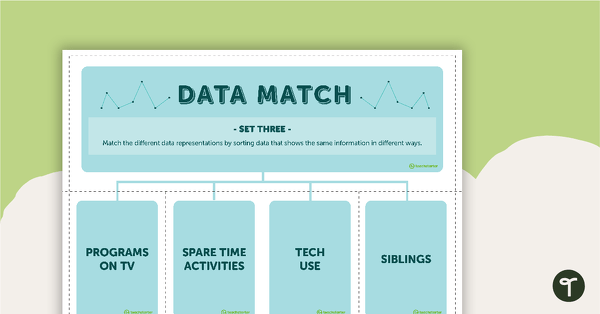
Data Match-Up Cards (Set 3)
A match-up activity for students to use when exploring data.
- Plus Plan
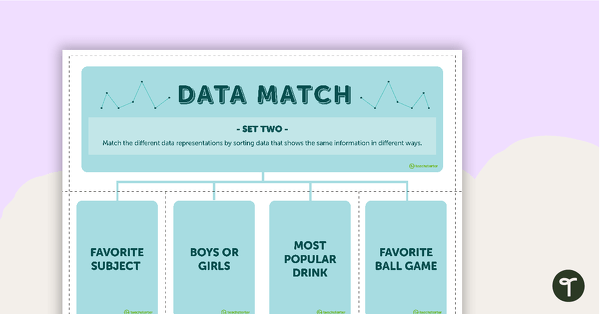
Data Match Game Cards (Set 2)
A match up game for students to use when exploring data.
- Plus Plan

Data Math Investigation - Should I Buy It?
Practice collecting and graphing data in a real-world situation.
- Plus Plan
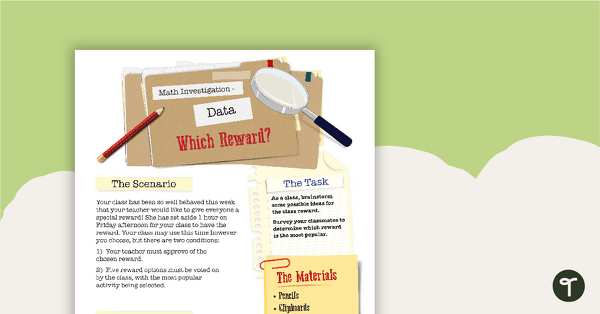
Data Math Investigation - Which Reward?
A mathematics investigation involving data collection and representation, embedded in a real-world context.
- Plus Plan

Data Match Game Cards (Set 1)
A match-up game for students to use when exploring data.
- Plus Plan
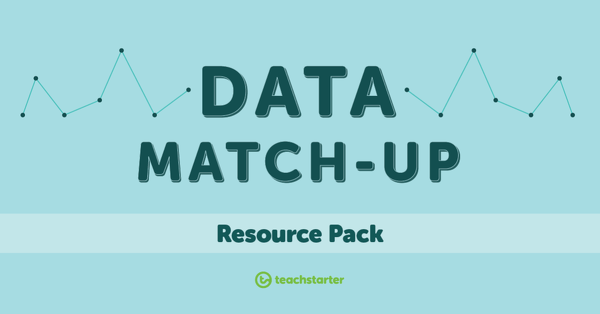
Data Match-Up Cards Resource Pack
A match-up activity resource pack for students to use when exploring data.