Graphs and Data Teaching Resources for Year 6
- Free Plan
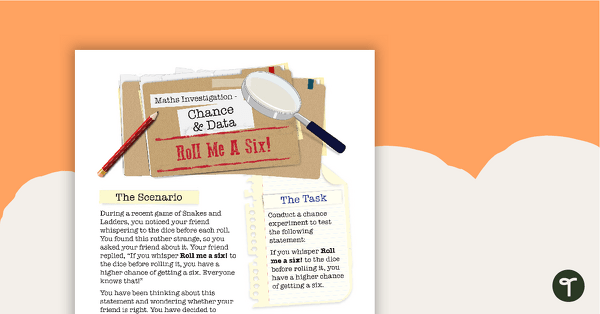
Chance and Data Maths Investigation - Roll Me a Six!
A mathematics investigation involving chance and data, embedded in a real-world context.
- Plus Plan
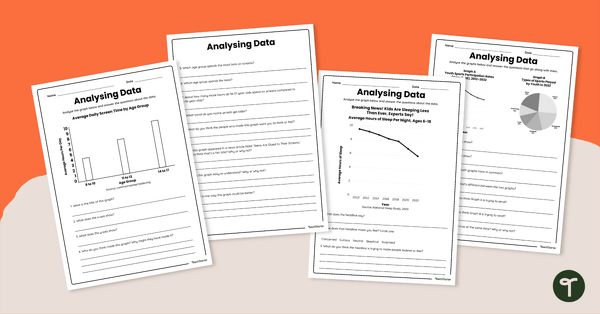
Analysing Data Worksheet Set
Share this analysing data worksheet set with your students to give them varied practice interpreting multiple data representations.
- Plus Plan
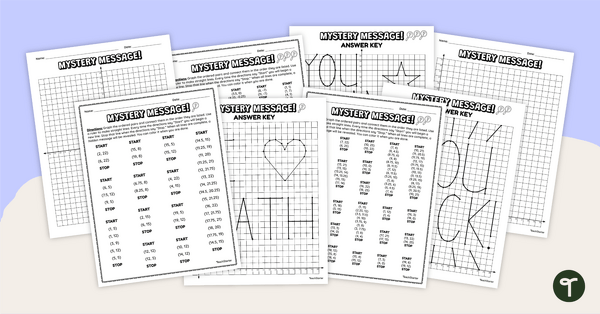
Cartesian Plane Mystery Pictures
Practise graphing on the Cartesian plane with this set of differentiated mystery pictures.
- Plus Plan
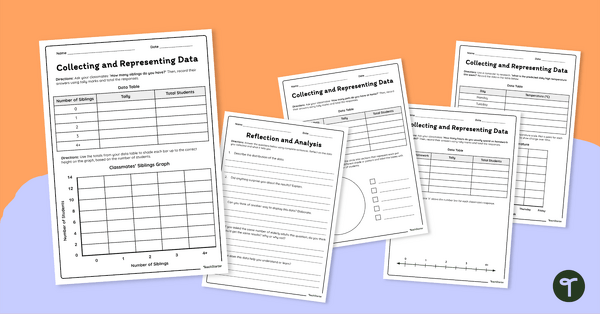
Collecting and Representing Data Worksheet Set
Download our collecting and representing data worksheet set to get your students collecting, organising and displaying data.
- Plus Plan
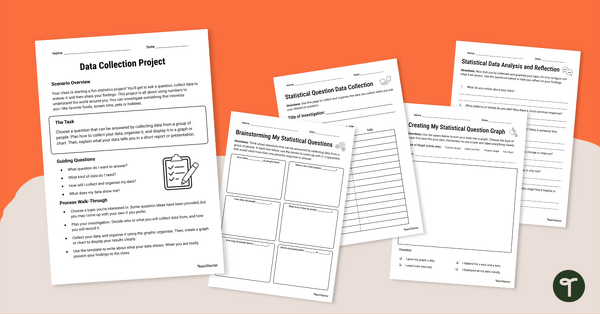
Data Collection Project
Complete this data collection project with your students to give them practise developing a statistical question, collecting data and displaying the results.
- Plus Plan
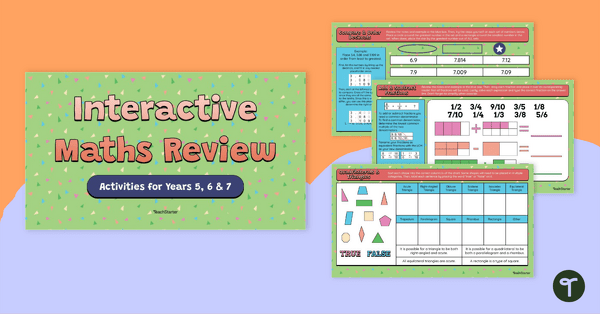
Interactive Maths Review – Activities for Years 5, 6 and 7
Review important maths concepts covered in years 5, 6 and 7 with a student-led interactive activity.
- Plus Plan
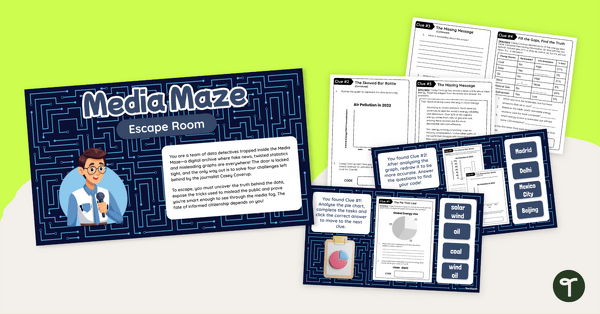
Interpreting Data Year 6 Escape Room
Play our interpreting data year 6 escape room to give your students engaging practise identifying and correcting misleading data displays.
- Plus Plan

Types of Graphs Posters and Worksheets
A collection of posters displaying the different types of graphs along with matching worksheets to assist students with laying out graphs on the page.
- Plus Plan
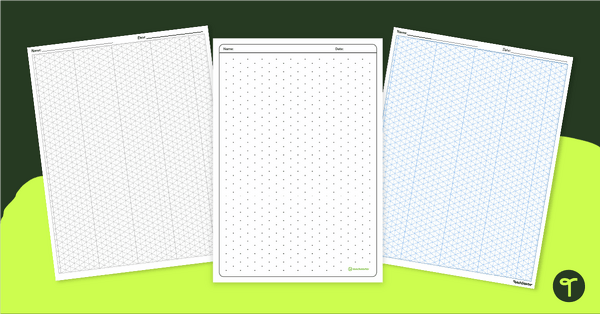
Isometric Drawing Paper - Dotty & Lined
Take your maths and design lessons to the next dimension with our collection of isometric drawing paper templates!
- Plus Plan
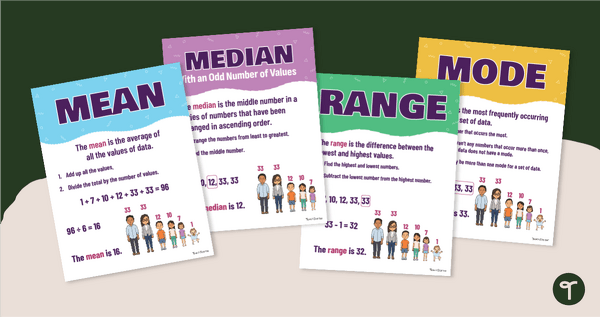
Mean, Median, Mode & Range Poster Pack
Download a Mean, Median, Mode & Range poster pack to help your students remember measures of central tendency.
- Plus Plan
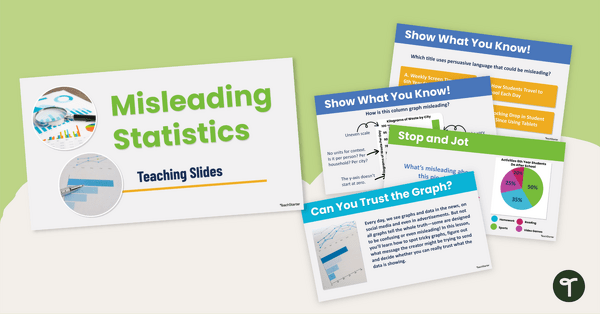
Misleading Statistics Teaching Slides
Use our misleading statistics teaching slides to increase statistical literacy and teach your students how to look at data displays with a critical eye.
- Plus Plan

Data Representation and Interpretation Worksheets - Year 6
8 data representation and interpretation worksheets linked to the Australian Curriculum.
- Plus Plan
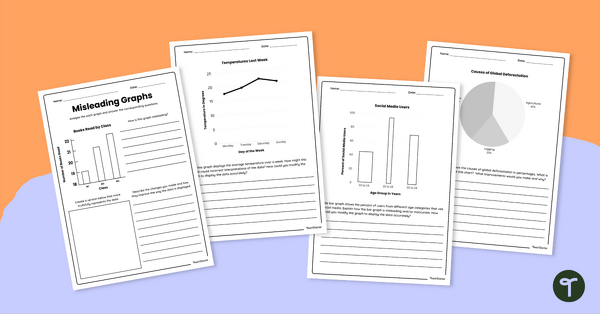
Misleading Graphs Worksheet Set
Download our misleading graphs worksheet set to increase your students’ abilities in statistical literacy and data analysis.
- Plus Plan
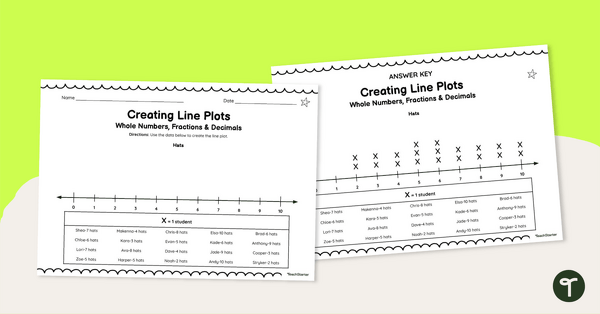
Creating Line Plots (With Whole Numbers, Fractions and Decimals) Worksheets
Help your students master data representation with this series of leveled worksheets for creating line plots.
- Plus Plan
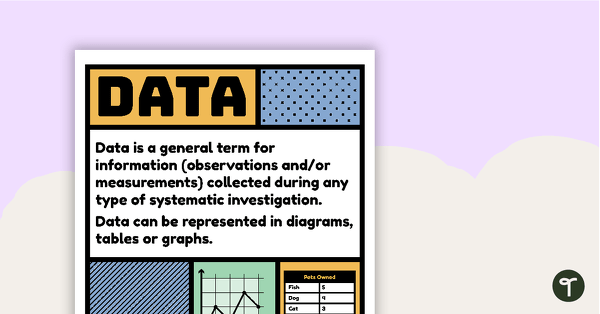
Data Vocabulary Poster
A poster that explains the concept of data and lists associated vocabulary.
- Plus Plan
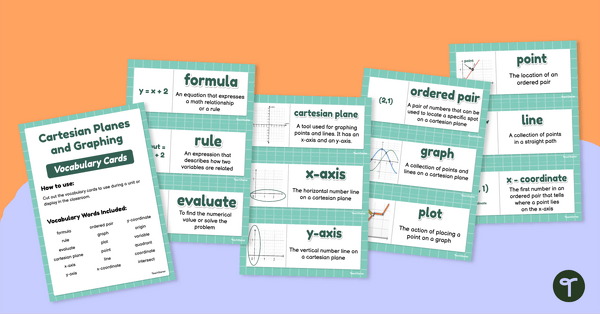
Cartesian Planes and Graphing – Vocabulary Cards
Introduce cartesian planes to your students with this set of 18 vocabulary cards.
- Plus Plan
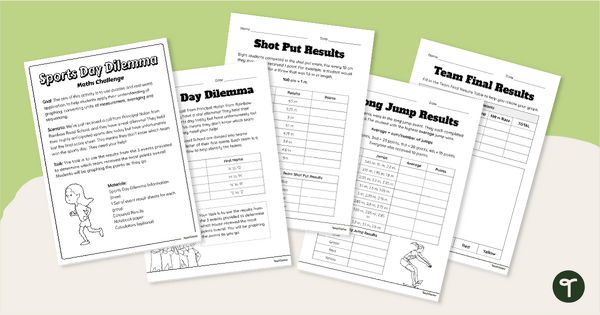
Sports Day Dilemma - Metric Conversions Maths Task
Engage students with a real-world application of measurement conversions with Sports Day Dilemma, a metric conversion maths task!
- Plus Plan
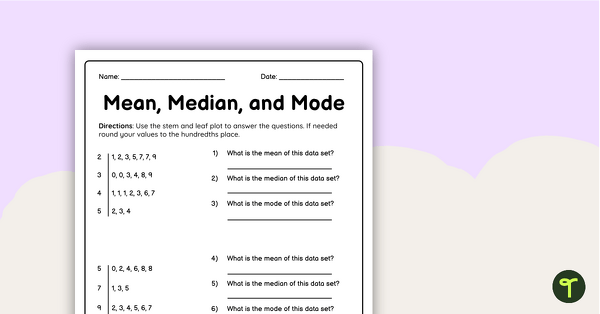
Mean Median Mode Worksheet
Use this double-sided worksheet to check students’ ability to find the mean, median and mode of given data sets.
- Plus Plan
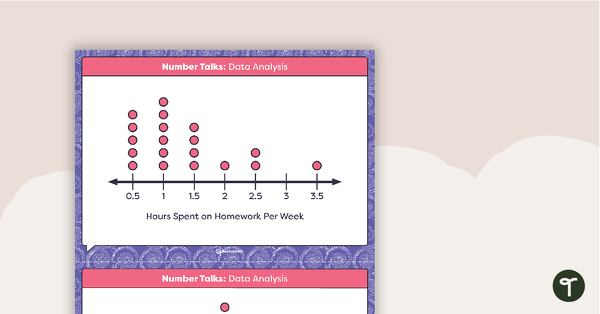
Number Talks - Data Analysis Task Cards
Build data analysis skills with this set of 26 task cards.
- Plus Plan
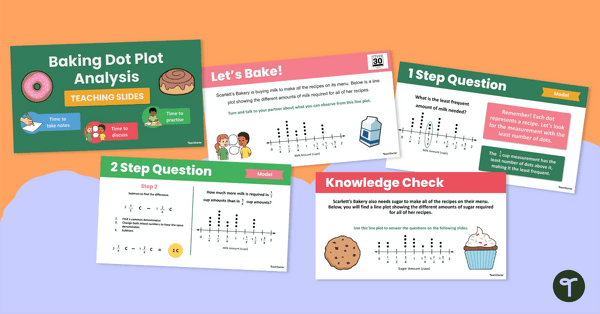
Baking Dot Plot Analysis Teaching Slides
Explore the sweet side of graphs and data with this bakery-themed dot plot resource, supporting your students' abilities to interpret dot plots!
- Plus Plan
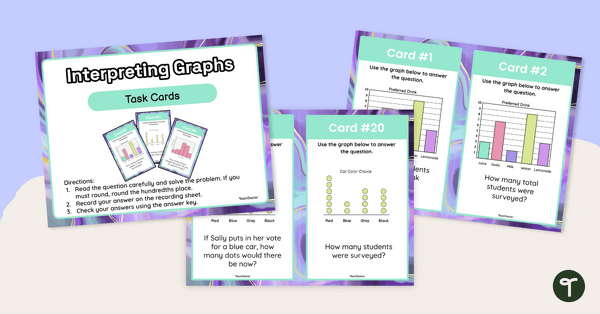
Interpreting Graphs Task Cards
Use this set of task cards students to practise interpreting column graphs, histograms and line plots.
- Plus Plan
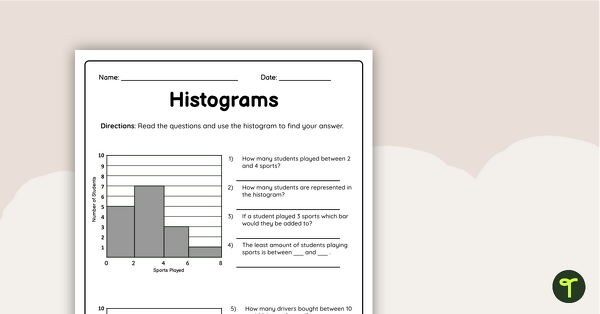
Histograms Worksheet
Encourage your students to practise reading and creating histogram graphs using this double-sided worksheet with answer key included.
- Free Plan
Dotted Journal Paper
Sheets of square dot paper templates.
- Plus Plan
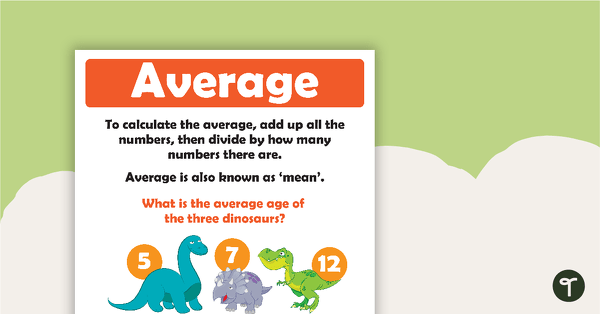
How To Calculate The Average Poster
A set of two posters which clearly show how to calculate the average of a group of numbers.
- Plus Plan
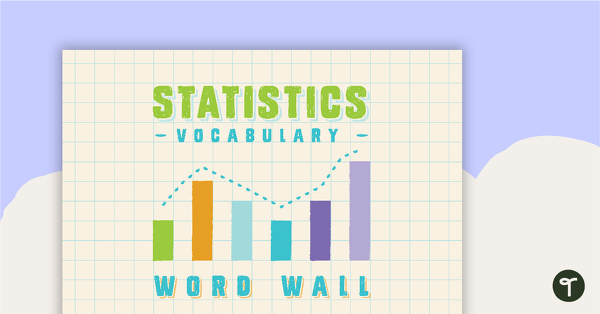
Statistics Word Wall Vocabulary
A comprehensive selection of statistics vocabulary for use on a Mathematics Word Wall.
- Plus Plan
Data Match-Up Cards Resource Pack
A match-up activity resource pack for students to use when exploring data.