Graphs and Data Teaching Resources for Year 5
- Plus Plan
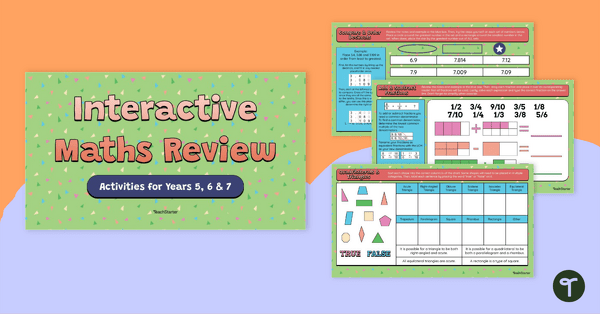
Interactive Maths Review – Activities for Years 5, 6 and 7
Review important maths concepts covered in years 5, 6 and 7 with a student-led interactive activity.
- Free Plan
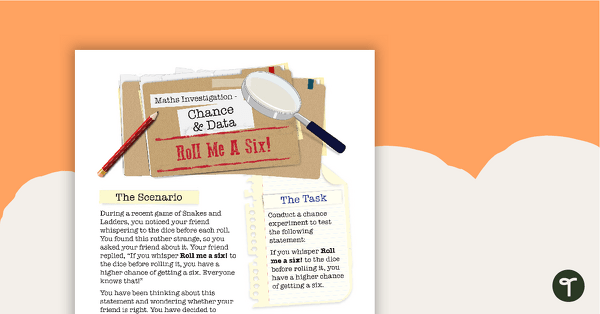
Chance and Data Maths Investigation - Roll Me a Six!
A mathematics investigation involving chance and data, embedded in a real-world context.
- Plus Plan
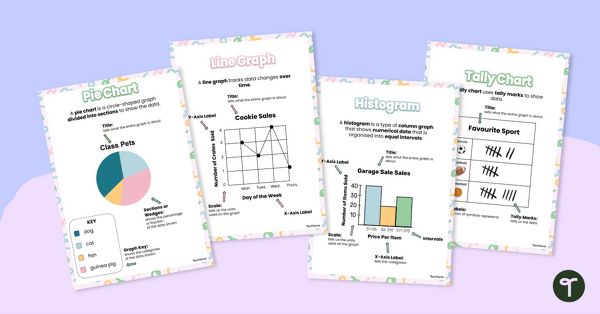
Types of Graphs Posters
This colourful and easy-to-digest visual display shows students the varying data displays they will encounter in their primary maths lessons.
- Plus Plan
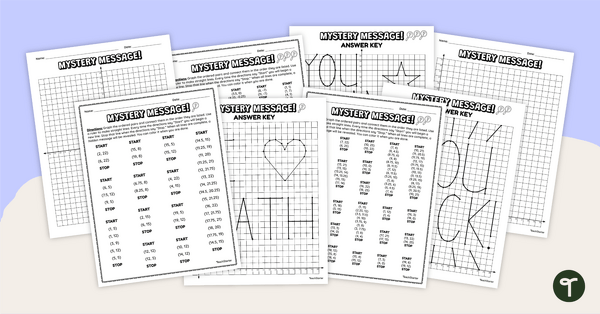
Coordinate Grid Mystery Pictures
Practise graphing ordered pairs with this set of differentiated coordinate grid mystery pictures.
- Plus Plan
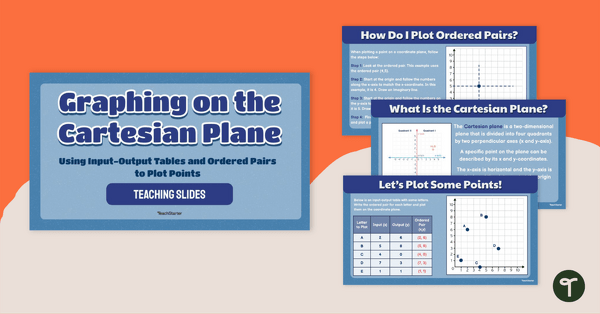
Graphing on the Cartesian Plane Teaching Slides
Teach your students how to plot points on a graph using ordered pairs from input-output tables with this set of teaching slides.
- Plus Plan
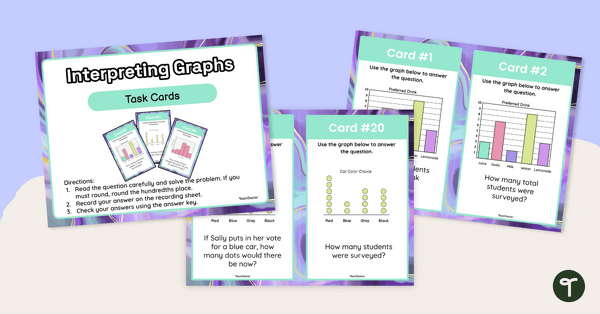
Interpreting Graphs Task Cards
Use this set of task cards students to practise interpreting column graphs, histograms and line plots.
- Plus Plan
Blank Graph Template
A blank template for constructing graphs.
- Plus Plan
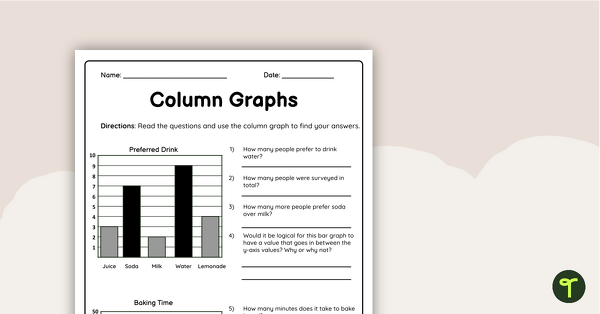
Column Graphs Grade 5 Worksheet
Use this double-sided column graphs worksheet to check your students’ understanding of interpreting and drawing column graphs.
- Plus Plan
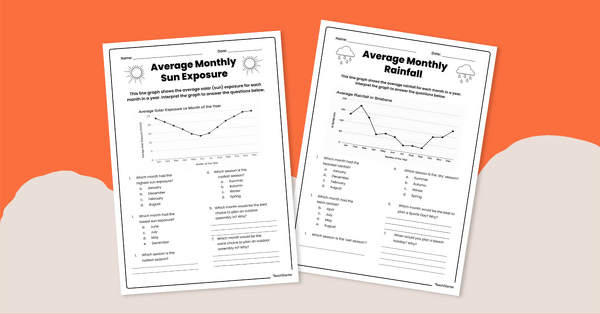
Interpreting Line Graphs Worksheet Pack
Use this set of 4 Grade 5 worksheets to help students practise interpreting real-life data represented as a line graph.
- Free Plan
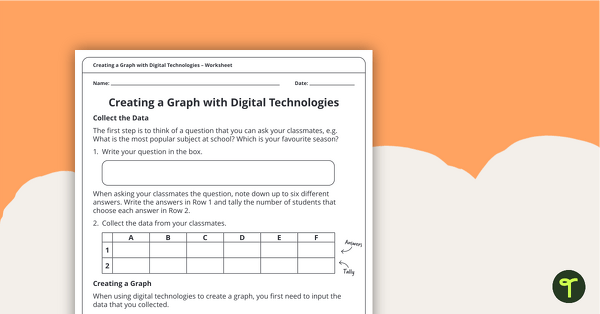
Creating a Graph Using Digital Technologies
A worksheet that supports students when collecting initial data and creating a digital graph.
- Plus Plan
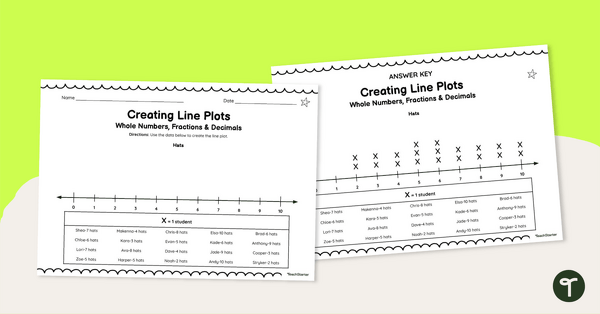
Creating Line Plots (With Whole Numbers, Fractions and Decimals) Worksheets
Help your students master data representation with this series of leveled worksheets for creating line plots.
- Plus Plan
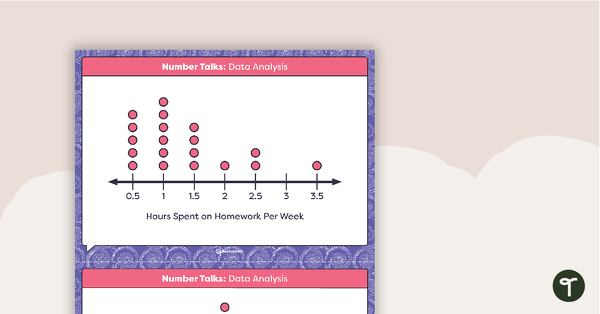
Number Talks - Data Analysis Task Cards
Build data analysis skills with this set of 26 task cards.
- Plus Plan
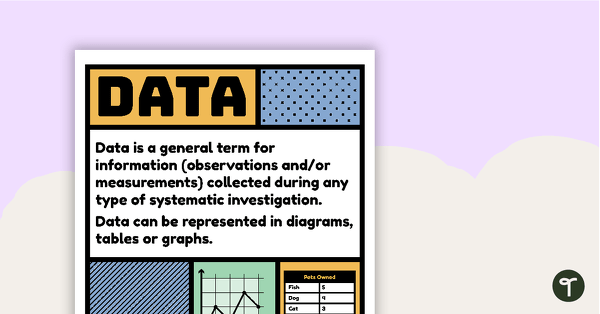
Data Vocabulary Poster
A poster that explains the concept of data and lists associated vocabulary.
- Plus Plan
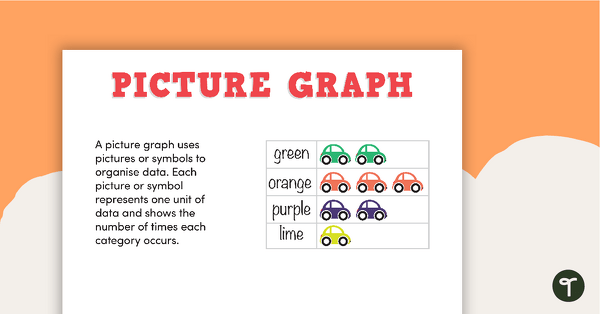
Types of Graphs Posters and Worksheets
A collection of posters displaying the different types of graphs along with matching worksheets to assist students with laying out graphs on the page.
- Plus Plan
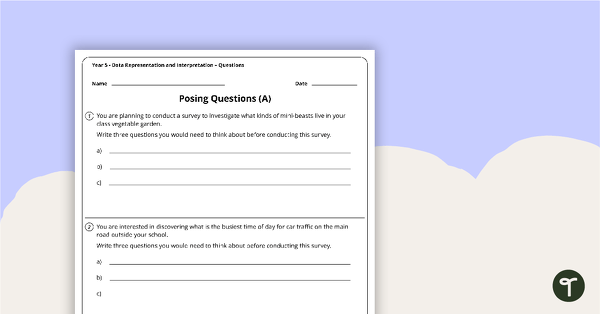
Data Representation and Interpretation Worksheets - Year 5
8 data representation and interpretation worksheets linked to the Australian Curriculum.
- Plus Plan
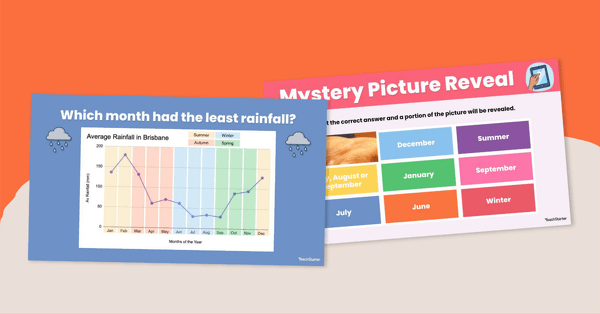
Interpreting Line Graphs Interactive Resource
Use this digital activity to teach students about interpreting real-life data represented as a line graph showing how measurements change over a period of time.
- Plus Plan
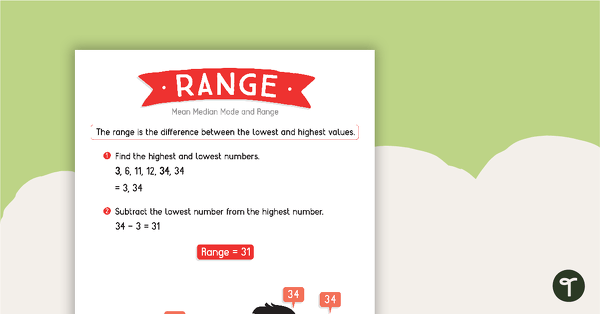
Mean, Median, Mode and Range Posters
Working with data is easy... when you can remember what each of the terms mean!
- Plus Plan
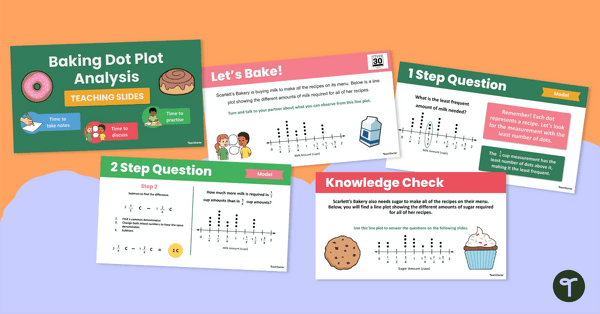
Baking Dot Plot Analysis Teaching Slides
Explore the sweet side of graphs and data with this bakery-themed dot plot resource, supporting your students' abilities to interpret dot plots!
- Plus Plan
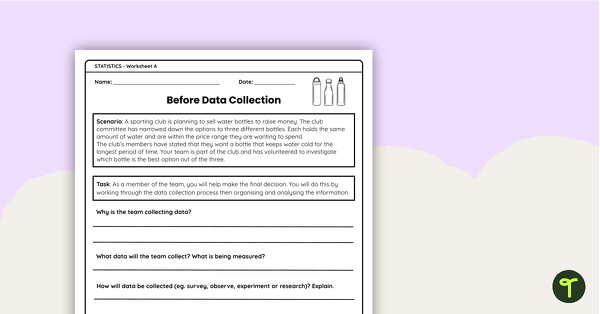
Interpreting Line Graphs Grade 5 Worksheet Set
- Plus Plan
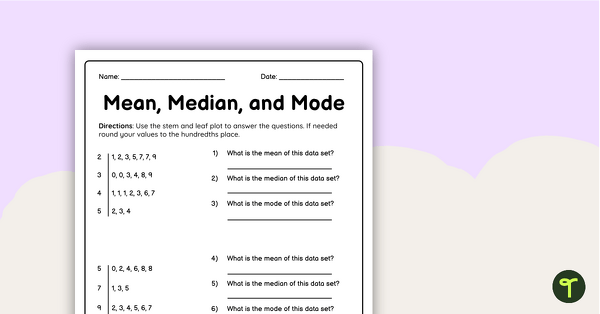
Mean Median Mode Worksheet
Use this double-sided worksheet to check students’ ability to find the mean, median and mode of given data sets.
- Plus Plan
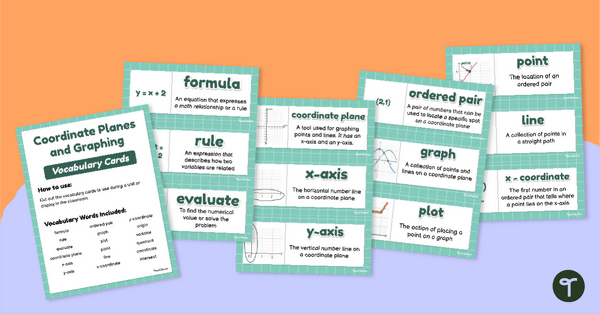
Coordinate Planes and Graphing – Vocabulary Cards
Promote maths vocabulary development with this set of 18 graphing and coordinate plane cards.
- Free Plan
Square Dot Paper
Sheets of square dot paper templates.
- Plus Plan
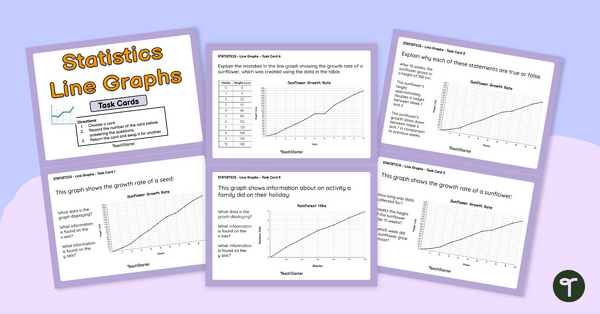
Interpreting Line Graphs Task Cards Grade 5
Use these task cards in your maths class to have students independently analyse and interpret line graphs.
- Plus Plan
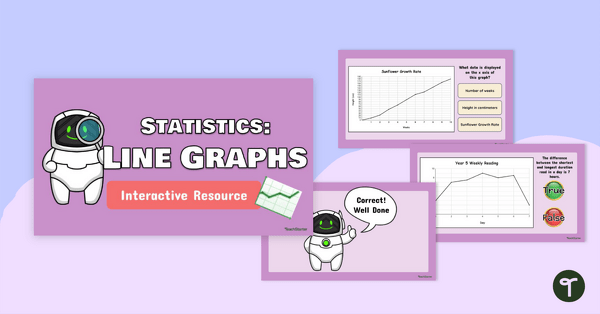
Interpreting Line Graphs Interactive Activity Grade 5
Solve the space man's line graph questions and complete the challenge with this interpreting line graphs interactive game!
- Plus Plan
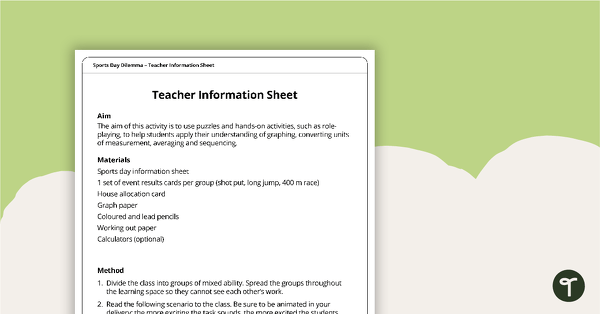
Sports Day Dilemma - Numeracy Whole Class Game
A whole class game that consolidates your students’ knowledge of measurement and graphing concepts – in a fun way!
- Plus Plan
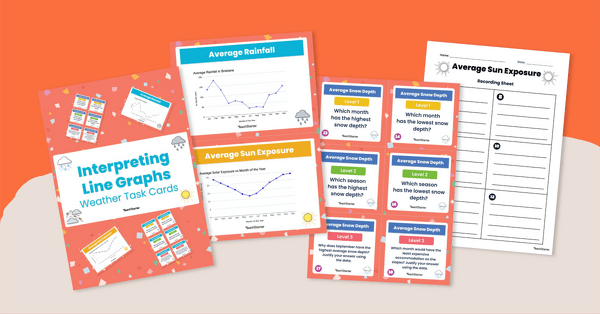
Interpreting Line Graphs Task Cards
Engage your Grade 5 learners with this task card set focused on interpreting line graphs.
- Plus Plan
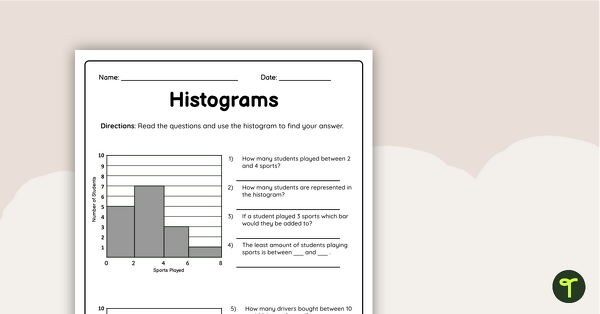
Histograms Worksheet
Encourage your students to practise reading and creating histogram graphs using this double-sided worksheet with answer key included.
- Plus Plan
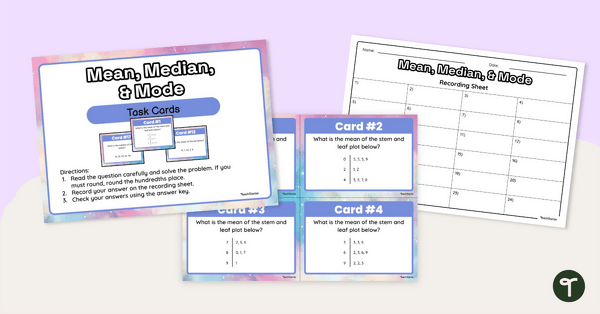
Mean Median and Mode Task Cards
Use this set of 24 data interpretation task cards to teach students to find the mean, median and mode of a limited data set.
- Plus Plan
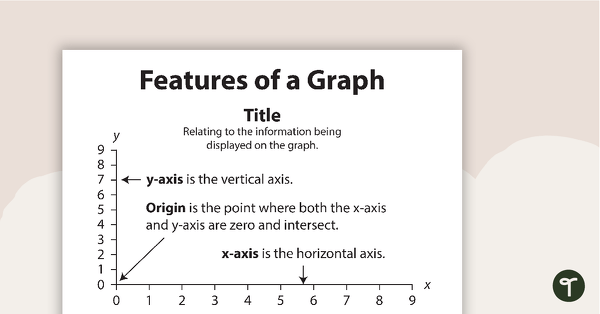
Features of a Graph BW
A poster showing the main features of a graph.
- Plus Plan
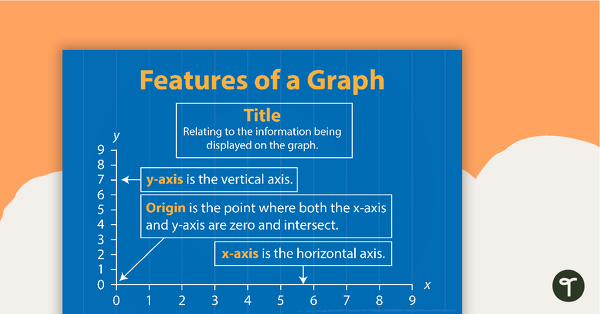
Features of a Graph
A poster showing the main features of a graph.
- Plus Plan
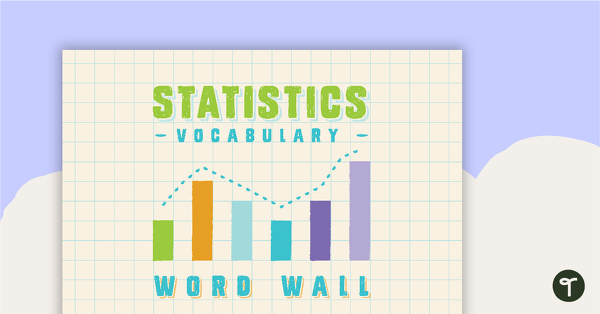
Statistics Word Wall Vocabulary
A comprehensive selection of statistics vocabulary for use on a Mathematics Word Wall.
- Plus Plan
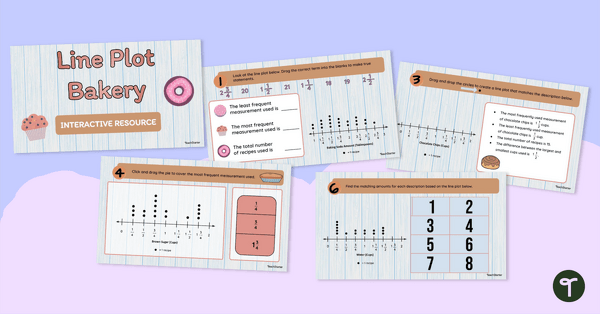
Line Plot Bakery Interactive Activity
Assign this bakery-themed interactive activity to your students to build their understanding of analyisng and creating line plots.