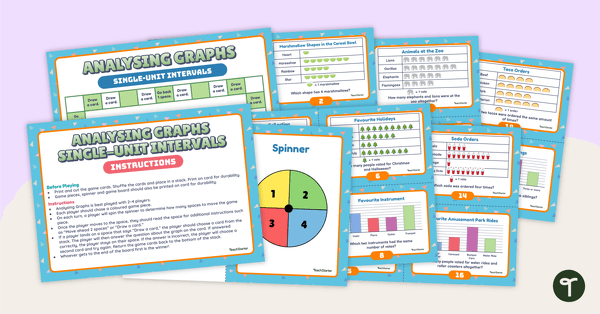
Sharpen data analysis skills when solving problems with information presented in a single-unit picture or column graph with this board game.
📊 Practise Analysing Column Graphs and Picture Graphs with a Board Game!
Are your students learning how to read and interpret data? Understanding the difference between different types of data displays can be tricky for young learners. With repeated practise, your students will master how to read graphs in no time! With this board game, students will practise reading bar graphs and pictographs that use a single-unit scale.
Through this activity, students will show they can solve “how many more” and “how many less” problems using information in single-unit bar graphs and pictographs.
Why Teachers Love This Graphing Board Game
This engaging board game is more than just fun—it’s a powerful teaching tool. Teachers can use it to reinforce key data interpretation skills in a hands-on, collaborative way. It encourages students to think critically, compare quantities, and solve problems using real data representations. Whether used in small groups, maths centres, or as a whole-class activity, this resource supports differentiated learning and helps students build confidence in reading graphs. Plus, it’s aligned with curriculum standards, making it a meaningful addition to your maths lessons.
Prepare This Data Analysis Resource for Your Students
Use the dropdown icon on the Download button to choose between the PDF or editable Google Slides version of this resource.
Print on thick card for added durability and longevity. Place all pieces in a folder or large envelope for easy access.
This resource was created by Allie Kleijnjans, a Teach Starter Collaborator.
More Graphing Fun!
The graphing fun doesn’t have to stop here. Here are more graphing resources made by teachers for teachers!
teaching resource
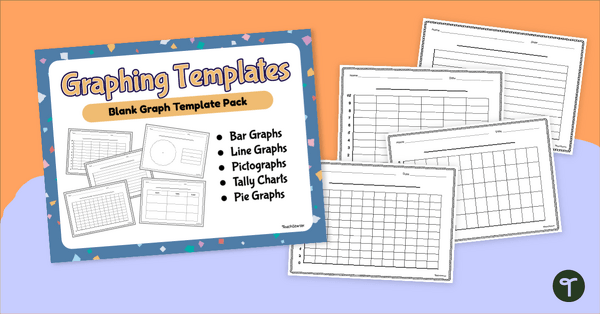
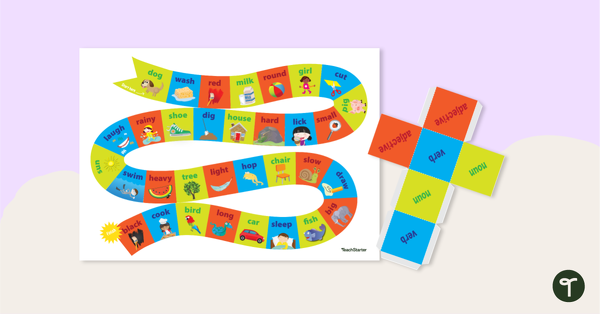
Blank Graph Template Pack
Construct your own graphs with a printable set of Blank Graph Templates.
teaching resource
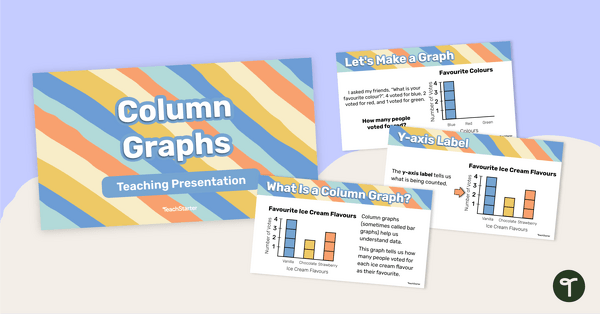
Column Graphs – Teaching Presentation
Learn all the features and how to construct a column graph with this 25-page teaching presentation.
teaching resource
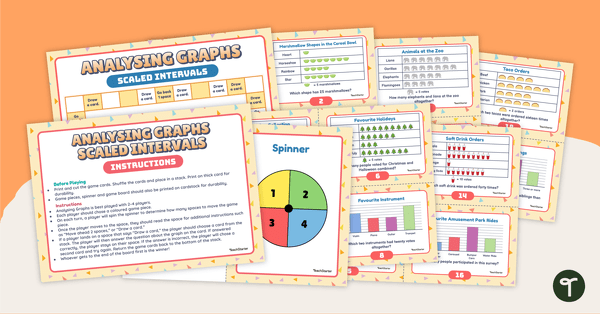
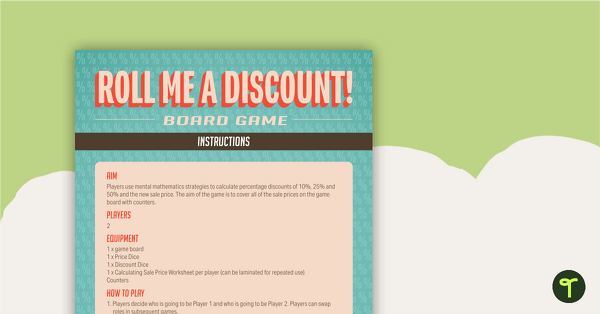
Analysing Graphs (Scaled Intervals) Board Game
Use this board game to sharpen data analysis skills when solving problems with information presented in a scaled picture or column graph.

0 Comments
Write a review to help other teachers and parents like yourself. If you'd like to request a change to this resource, or report an error, select the corresponding tab above.