Statistics and Probability
Based on the Australian Curriculum, Statistics and Probability in Mathematics Year 2 includes:
- Plus Plan
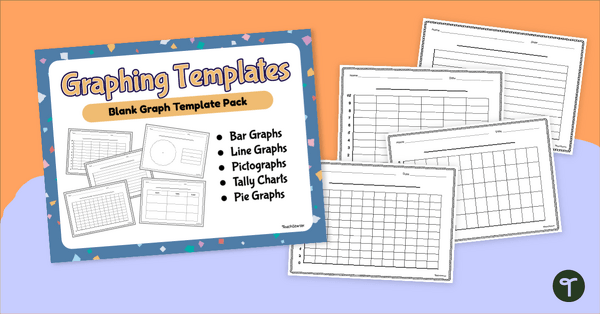
Blank Graph Template Pack
Construct your own graphs with a printable set of Blank Graph Templates.
- Plus Plan

Types of Graphs Posters
Show students the varying data displays they will encounter in their primary maths lessons with these colourful and easy-to-digest visual posters.
- Free Plan
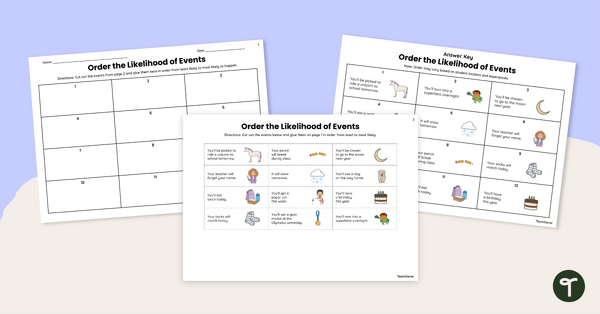
Order the Likelihood of Events Worksheet
Download our Order the Likelihood of Events worksheet to introduce students to beginning concepts of probability and chance.
- Plus Plan
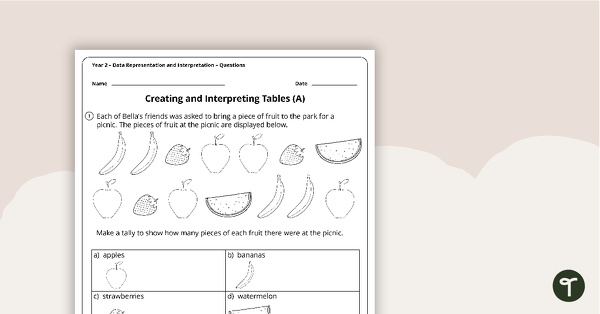
Data Representation and Interpretation Worksheets - Year 2
4 data representation and interpretation worksheets linked to the Australian Curriculum.
- Plus Plan
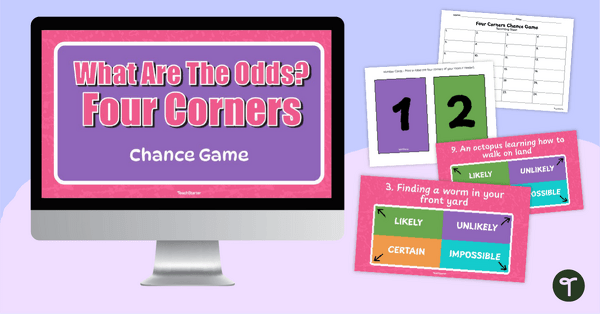
What Are The Odds? Digital Chance Game
Introduce your students to the concepts of probability and chance with an interactive ‘What Are The Odds?” Active Game?
- Plus Plan
Chance Middle Years PowerPoint
An engaging 36 slide interactive PowerPoint to use in the classroom when learning about chance in the middle years.
- Free Plan

Picture Graph Templates
A set of blank picture graph templates for students to represent data.
- Plus Plan
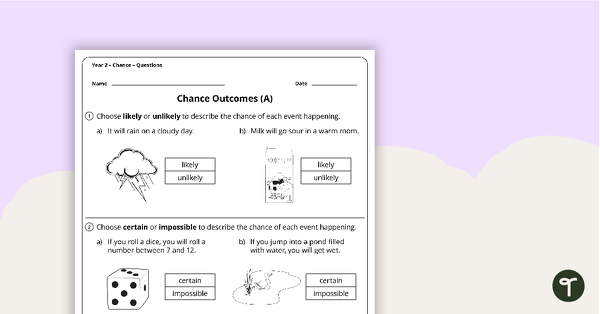
Chance Worksheets - Year 2
2 chance worksheets linked to the Australian Curriculum.
- Plus Plan
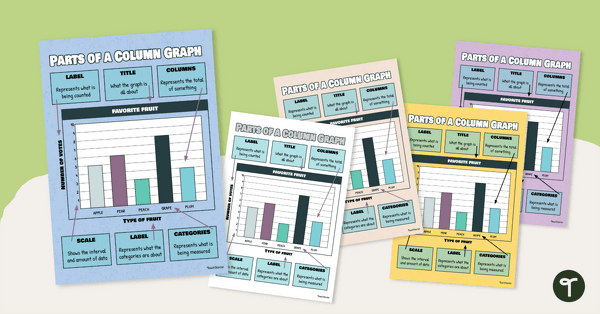
Column / Bar Graph Poster
Hang this column / bar graph poster in your classroom to teach your students about the different parts of this commonly used graph.
- Plus Plan
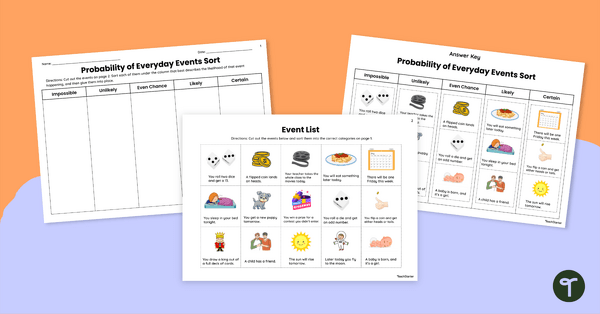
Probability of Everyday Events Sort
Share this probability of everyday events sort with your students to give them hands on practice identifying the likelihood of common events.
- Plus Plan
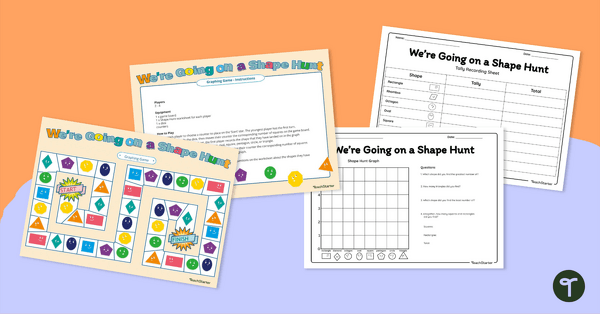
We're Going On a Shape Hunt! Graphing Game
Consolidate students' knowledge of 2D shapes while teaching about data collection, recording and graphing!
- Free Plan
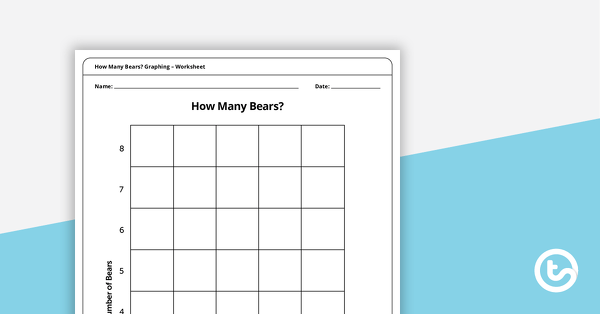
How Many Bears? Graphing – Worksheet
A hands-on picture graph worksheet for students to sort and count coloured bears.
- Plus Plan

Analysing Graphs – Single-Unit Bar Graphs and Pictographs – Task Cards
Use data analysis skills to analyse bar graphs and pictographs with this set of task cards.
- Plus Plan

Chance Lower Years PowerPoint
An engaging 22 slide interactive PowerPoint to use in the classroom when learning about chance in the lower years.
- Plus Plan
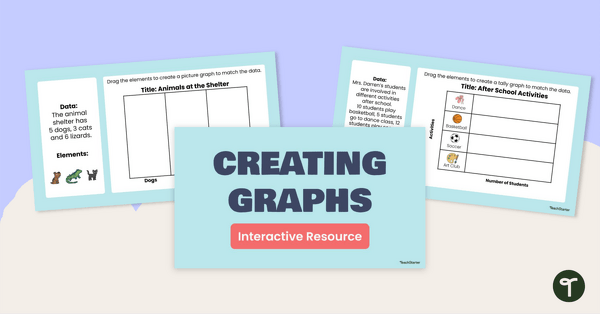
Creating Graphs Interactive Activity
Share this interactive activity with your students to help them practise using digital tools to create graphs from raw data.
- Plus Plan
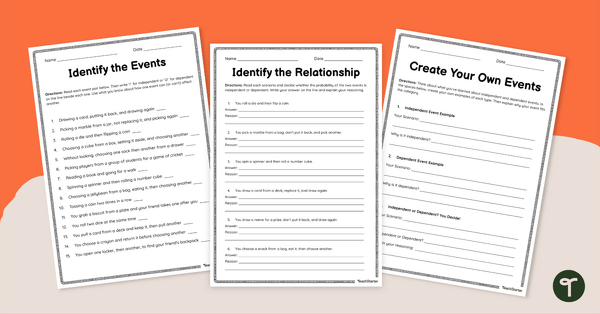
Independent and Dependent Probability Worksheet Set
Provide students with this independent and dependent probability worksheet set to give them practice identifying independent and dependent events.
- Plus Plan
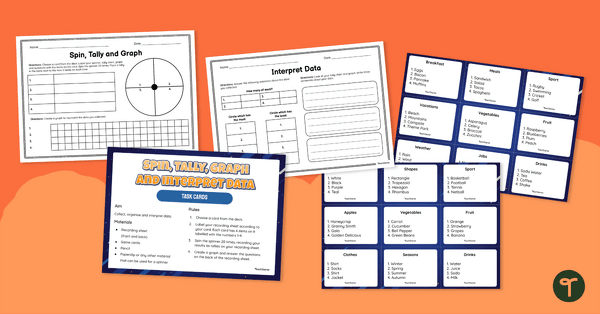
Spin, Tally, Graph and Interpret Data Task Card Activity
Guide your students to collect data, make tally marks, create a column graph and analyse data with this maths activity.
- Plus Plan
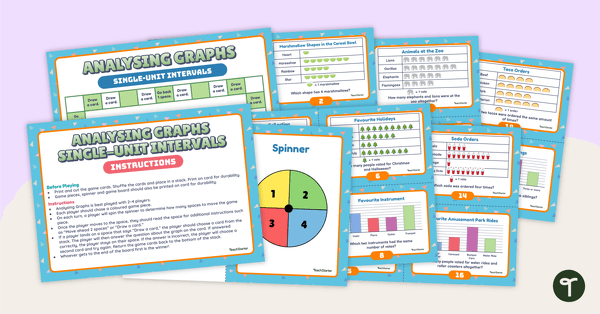
Analysing Graphs (Single-Unit Intervals) Board Game
Sharpen data analysis skills when solving problems with information presented in a single-unit picture or column graph with this board game.
- Plus Plan

Class Carnival – Probability STEM Challenges
A set of four carnival-themed STEM challenges where students create fun games that incorporate probability.
- Plus Plan
Picture Graph Playoff – Maths Game
A fun picture graph game for students to consolidate gathering and representing data.
- Free Plan
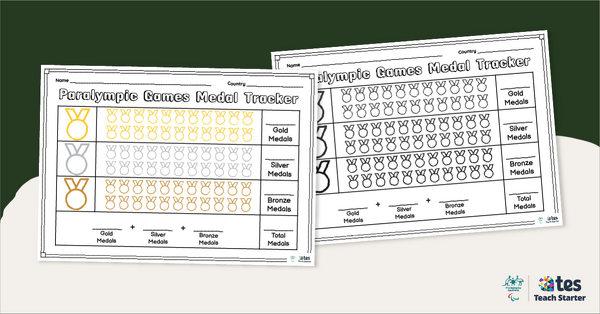
Paralympic Medal Tracking Template
Help your students keep track of the medals won during the Paralympics with our easy-to-use Paralympic medal tracker.