Math 1.8
Data analysis. The student applies mathematical process standards to organize data to make it useful for interpreting information and solving problems. The student is expected to:
- (1) collect, sort, and organize data in up to three categories using models/representations
such as tally marks or T-charts;
- (A) use data to create picture and bar-type graphs; and
- (B) draw conclusions and generate and answer questions using information from picture and bar-type graphs.
- Free Plan
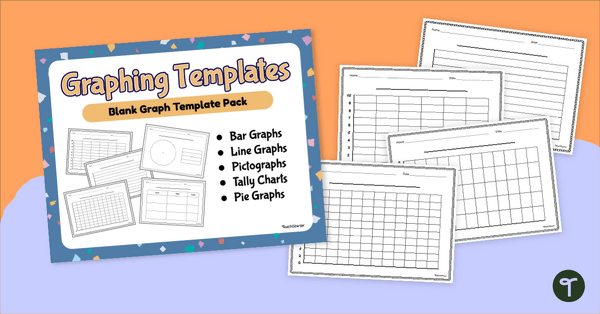
Blank Graph Template Pack
Construct your own graphs with a printable set of Blank Graph Templates.
- Free Plan
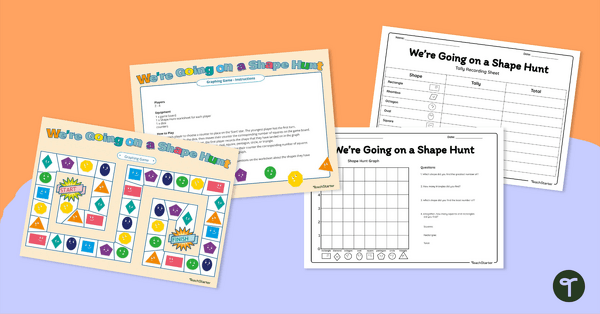
We're Going On a Shape Hunt! Graphing Game
Consolidate students' knowledge of 2D shapes while teaching about data collection, recording and graphing!
- Plus Plan
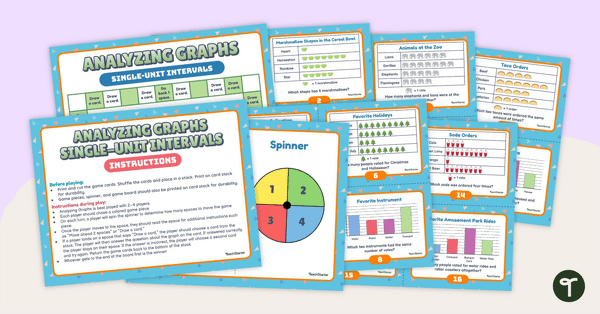
Analyzing Graphs (Single-Unit Intervals) – Board Game
Sharpen student data analysis skills when solving problems with information presented in a single-unit picture graph and bar graph with this board game.
- Plus Plan
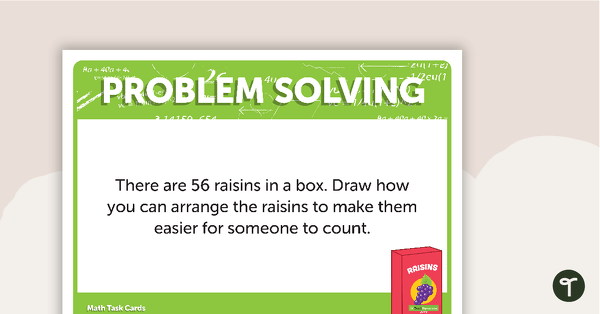
Open-ended Math Problem Solving - Grades 1, 2, and 3 (Task Card Version)
A set of 20 open-ended problem solving task cards covering a range of mathematical concepts.
- Plus Plan
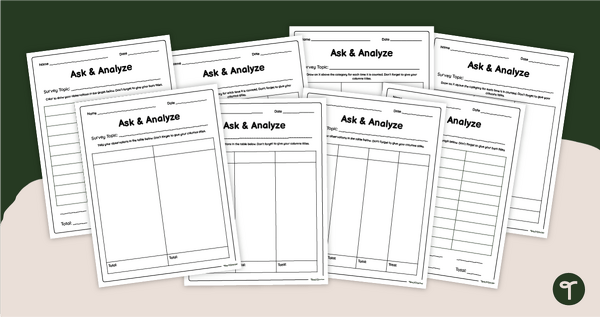
Data Collection Worksheets - Blank Survey Template
Organize student survey data with a set of printable survey data collection worksheets.
- Plus Plan
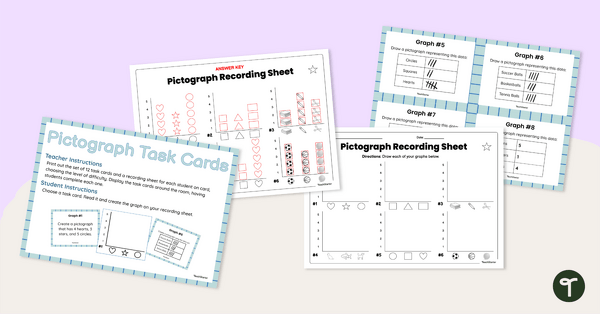
Graphing (Pictographs) Task Cards
Get graphing! Use these levelled pictograph task cards to show students a variety of data collection records, and have them create pictographs to represent that data.
- Free Plan
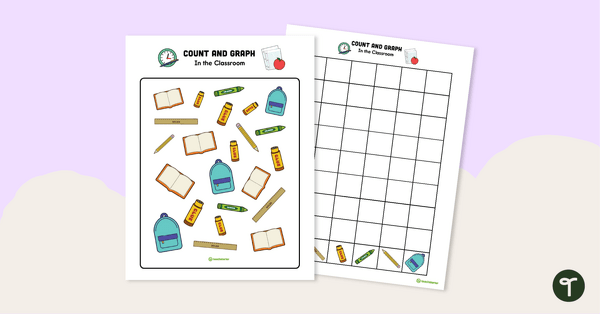
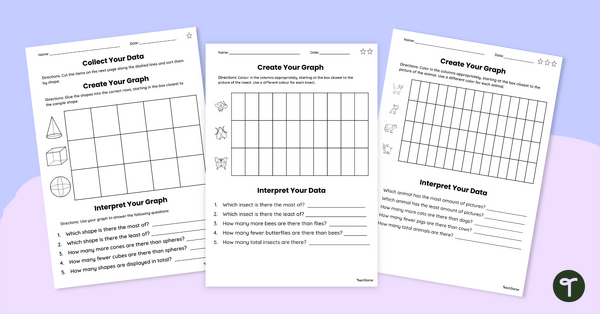
Count and Graph – In the Classroom
Practice collecting, sorting, and organizing data to create a graph with this 2-page worksheet.
- Plus Plan
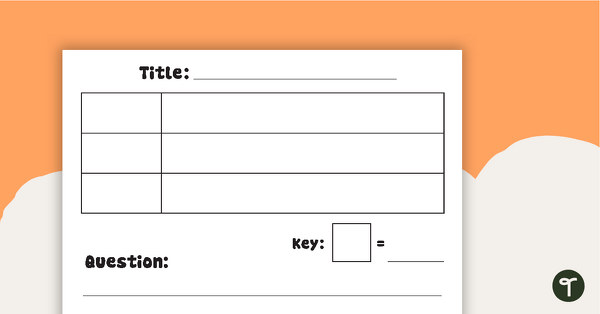
Picture Graph Templates
A set of blank picture graph templates for students to represent data.
- Plus Plan
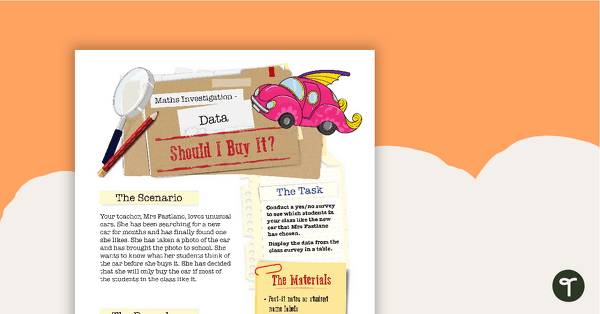
Data Math Investigation - Should I Buy It?
Practice collecting and graphing data in a real-world situation.
- Plus Plan
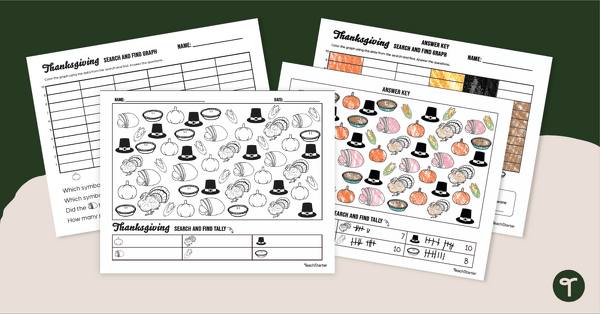
Thanksgiving Graphing Activity for Kindergarten
Practice counting and graphing with a fun Thanksgiving Graphing Activity for kindergarten.
- Free Plan
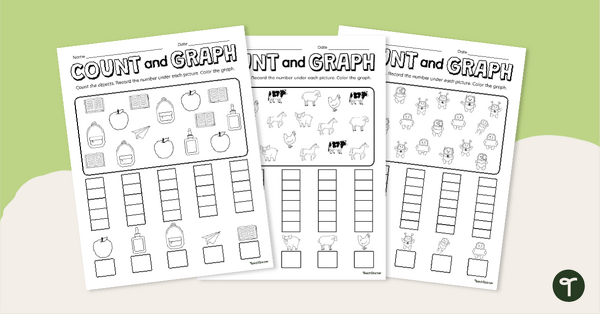
Count and Graph Worksheet Pack
Explore counting and graphing skills with this set of three worksheets.
- Plus Plan
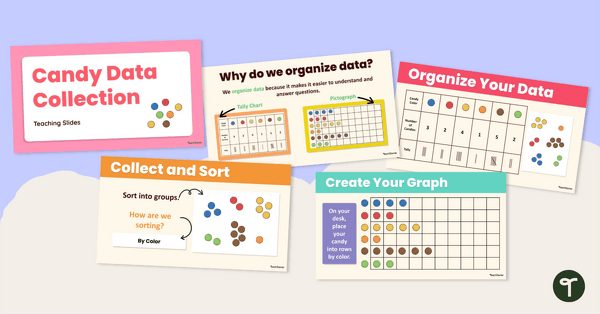
Candy Data Collection Instructional Slide Deck
Explore this candy-themed data collection teaching presentation to teach students the basics of acquiring and recording data.
- Plus Plan
Data Collection Worksheet Set
Use this set of differentiated graphs worksheets to assess your students’ understanding of how data is collected, organized and presented.
- Plus Plan
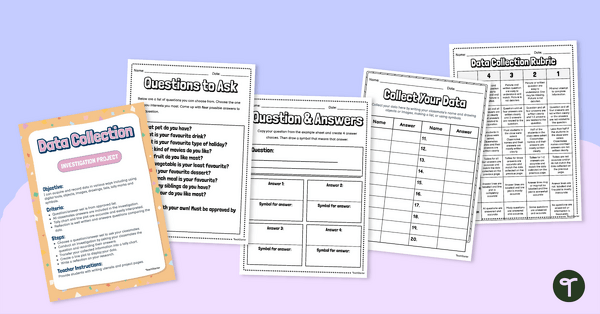
Data Collection Investigation Project
Assign this data collection project to enable students to master the skills of gathering, recording, and graphing data.
- Plus Plan
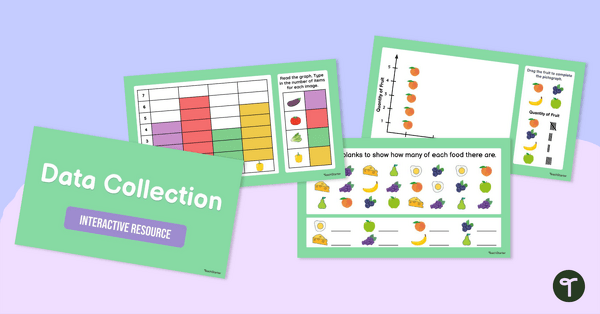
Data Collection Interactive Activity
Check your students’ understanding of interpreting data and using it to create graphs using this fun interactive game.
- Plus Plan
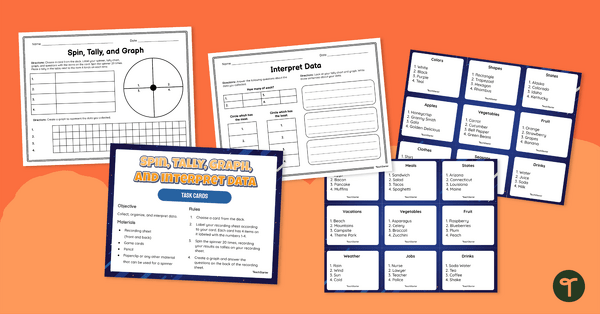
Spin, Tally, Graph and Interpret Data – Task Card Activity
Guide your students to collect data, make tally marks, create a bar graph and analyze data with this math activity designed for 1st and 2nd-grade students.
- Plus Plan
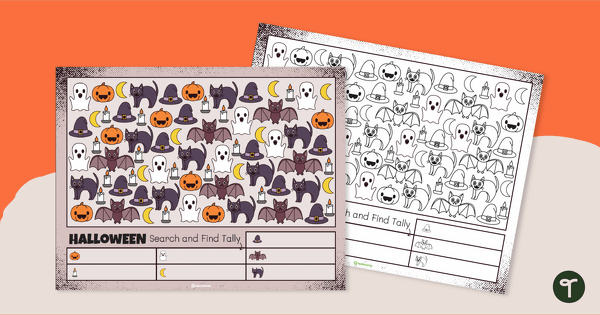
Search and Find – Halloween Math Worksheet
Get your students in the mood for Halloween with this fun search and find activity.
- Plus Plan
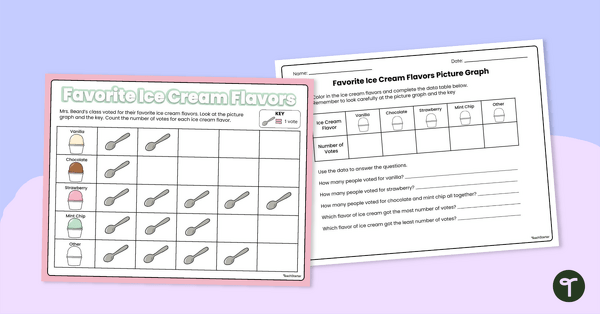
Picture Graphs - Worksheet
Use this double-sided worksheet to help your students practice reading and evaluating a simple picture graph.
- Plus Plan
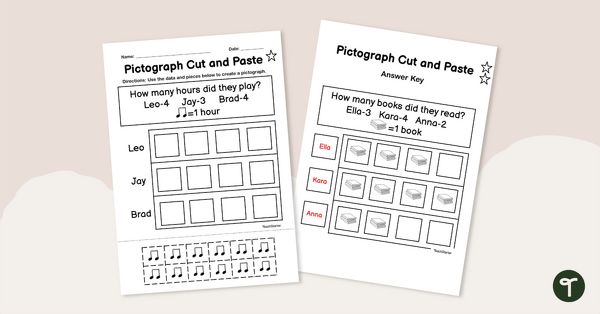
Pictograph Cut and Paste Worksheet
Use this fun cut-and-paste worksheet to build student understanding of pictographs and encourage them to practice their fine motor skills.
- Plus Plan
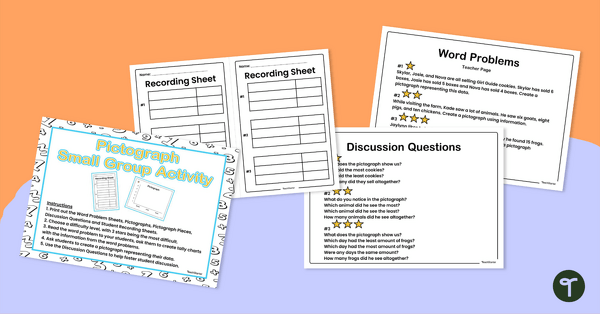
Create a Pictograph – Small Group Activity
Teach students how to create simple pictographs using data from word problems with this small group activity.
- Plus Plan
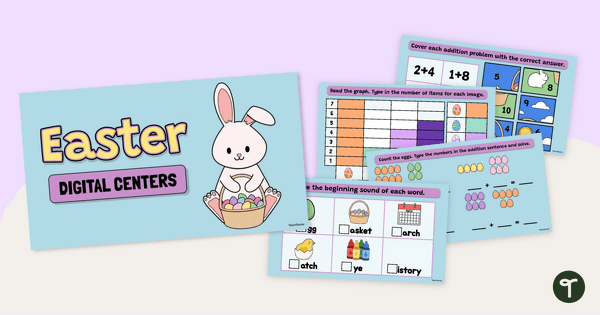
Easter Literacy and Math Centers - Digital Learning Activity
Lost the lesson-planning stress this Easter season with an exciting no-prep digital Easter Literacy and Math center.
- Plus Plan
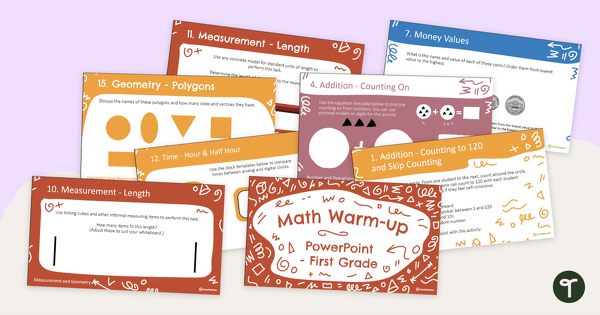
Math Warm-Ups Interactive PowerPoint - Grade 1
A PowerPoint providing a series of warm-up activities for Grade 1 students across the mathematics curriculum.
- Plus Plan
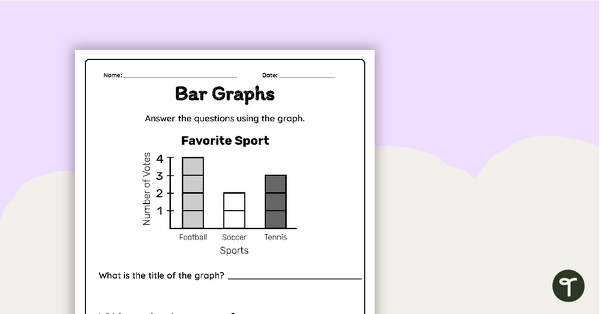
Interpreting a Bar Graph – Worksheet
Interpret information from a bar graph and answer questions with this worksheet.
- Plus Plan
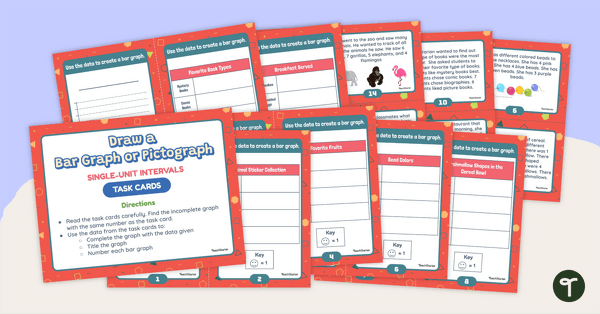
Draw a Bar Graph and Pictograph Task Cards (Single-Unit Intervals)
Practice drawing single-unit bar graphs and pictographs with this set of task cards.
- Plus Plan
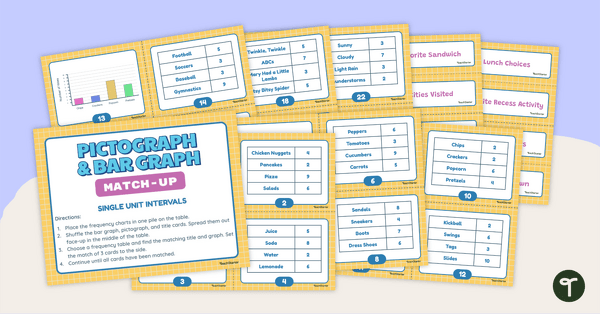
Pictograph and Bar Graph Match-Up (Single-Unit Intervals)
Use data analysis skills to match frequency tables with a corresponding bar graph or pictograph.
- Plus Plan
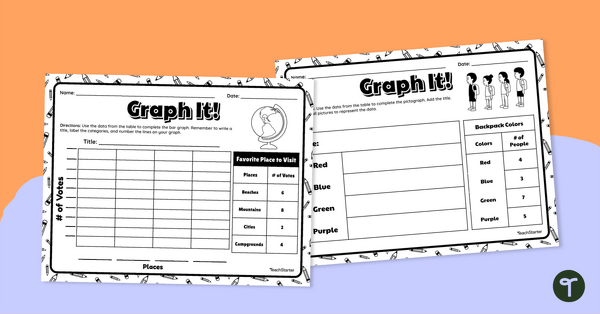
Graph It! Worksheet (Single-Unit Intervals)
Draw a single-unit picture graph and bar graph to represent data with this worksheet.
- Plus Plan
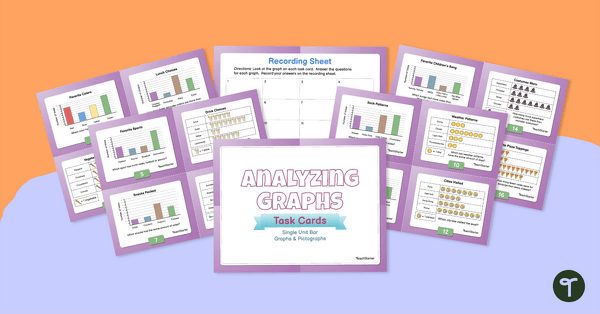
Analyzing Graphs – Single-Unit Bar Graphs & Pictographs – Task Cards
Use data analysis skills to analyze bar graphs and pictographs with this set of task cards.
- Plus Plan
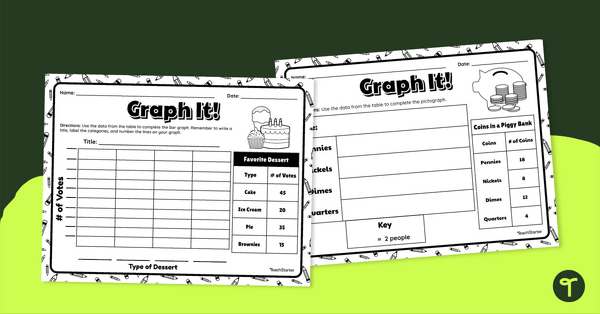
Graph It! Worksheet (Scaled Intervals)
Draw a scaled picture graph and bar graph to represent data with this worksheet.
- Plus Plan
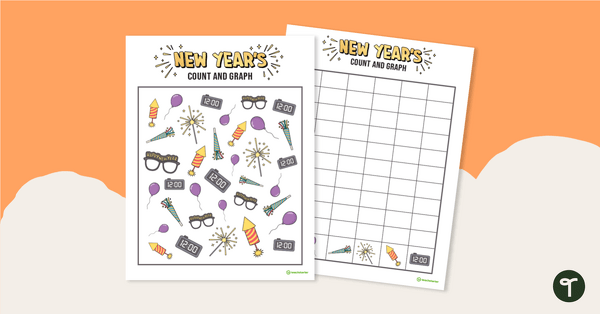
Count and Graph – New Year's Edition
Celebrate the new year by counting festive images and notating their totals as a bar graph.
- Plus Plan
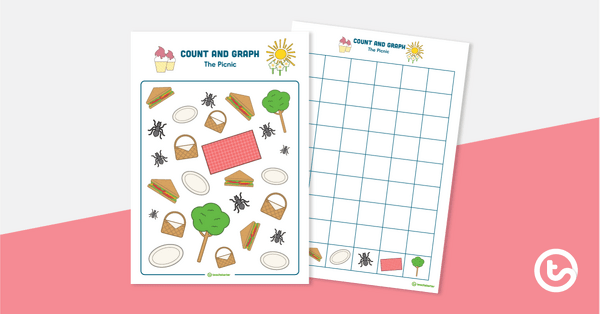
Count and Graph – The Picnic
Practice collecting, sorting, and organizing data to create a graph with this 2-page worksheet.
- Plus Plan
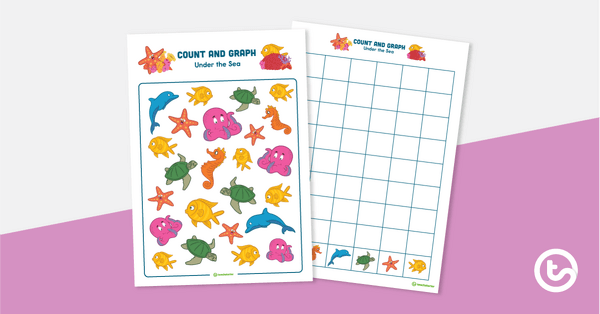
Count and Graph – Under the Sea
Practice collecting, sorting, and organizing data to create a graph with this 2-page worksheet.
- Plus Plan
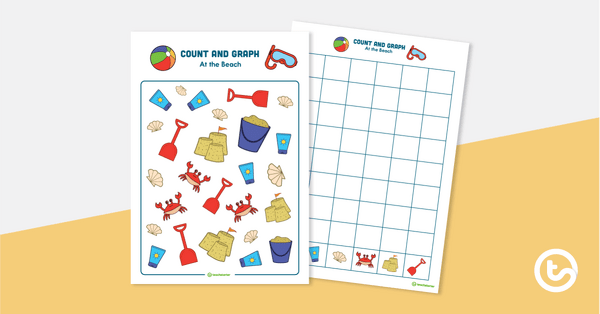
Count and Graph – At the Beach
Practice collecting, sorting, and organizing data to create a graph with this 2-page worksheet.