Statistics and Probability
Statistics and Probability
- Plus Plan
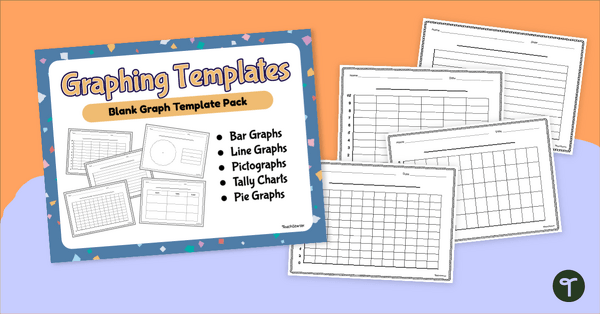
Blank Graph Template Pack
Construct your own graphs with a printable set of Blank Graph Templates.
- Plus Plan

Types of Graphs Posters
Show students the varying data displays they will encounter in their primary maths lessons with these colourful and easy-to-digest visual posters.
- Plus Plan
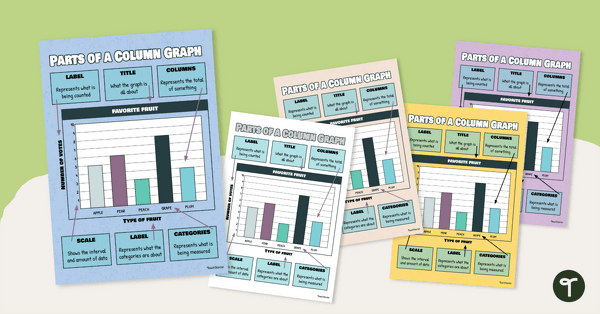
Column / Bar Graph Poster
Hang this column / bar graph poster in your classroom to teach your students about the different parts of this commonly used graph.
- Plus Plan
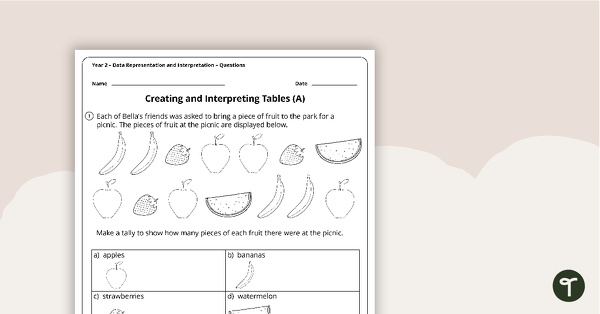
Data Representation and Interpretation Worksheets - Year 2
4 data representation and interpretation worksheets linked to the Australian Curriculum.
- Plus Plan
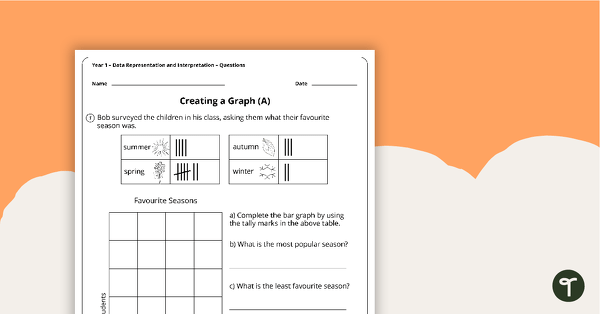
Data Representation and Interpretation Worksheets - Year 1
Two data representation and interpretation worksheets linked to the Australian Curriculum.
- Plus Plan
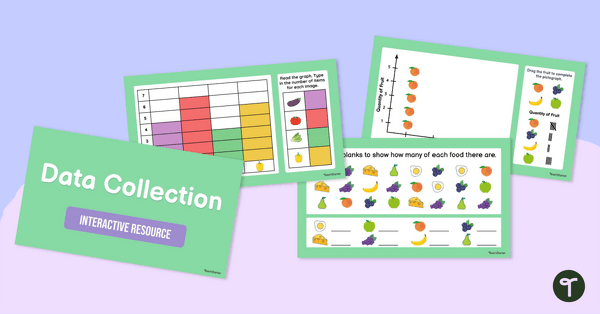
Data Collection Interactive Activity
Check your students’ understanding of interpreting data and using it to create graphs using this fun and colourful interactive game.
- Free Plan
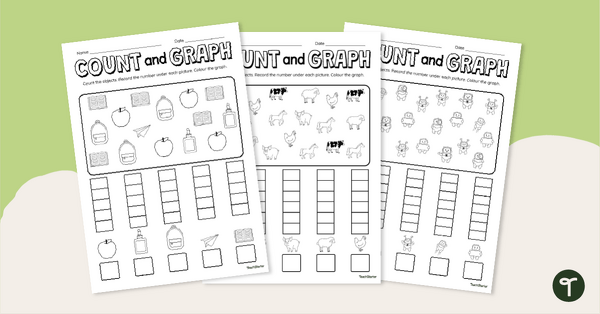
Count and Graph Worksheet Pack
Explore counting and graphing skills with this set of three worksheets.
- Free Plan

Picture Graph Templates
A set of blank picture graph templates for students to represent data.
- Plus Plan

Analysing Graphs – Single-Unit Bar Graphs and Pictographs – Task Cards
Use data analysis skills to analyse bar graphs and pictographs with this set of task cards.
- Plus Plan
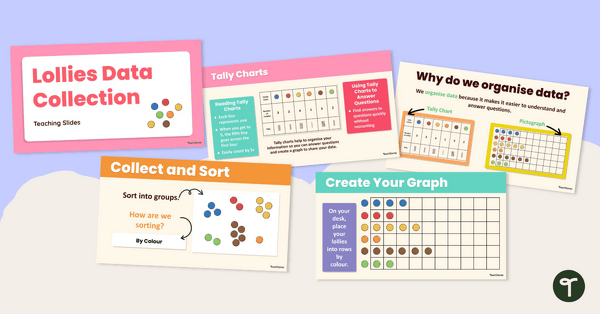
Lollies Data Collection Instructional Slide Deck
Explore this sweet-themed data collection teaching presentation to teach students the basics of recording data and creating a pictograph.
- Plus Plan
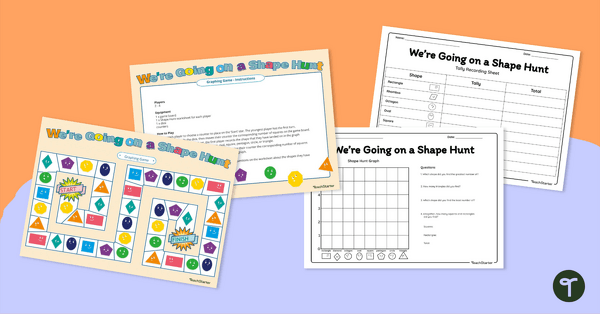
We're Going On a Shape Hunt! Graphing Game
Consolidate students' knowledge of 2D shapes while teaching about data collection, recording and graphing!
- Plus Plan
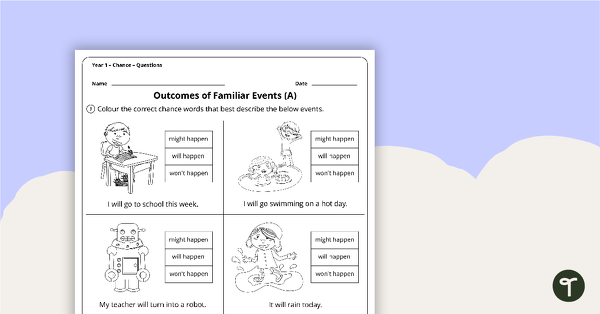
Chance Worksheets - Year 1
2 chance worksheets linked to the Australian Curriculum.
- Plus Plan
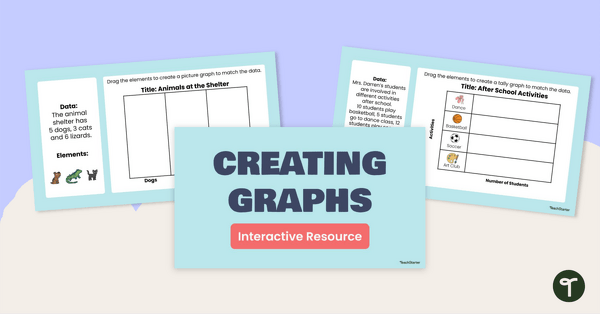
Creating Graphs Interactive Activity
Share this interactive activity with your students to help them practise using digital tools to create graphs from raw data.
- Free Plan
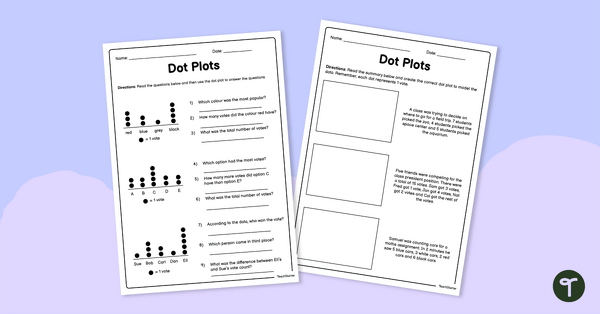
Dot Plot Worksheet
Practise analysing and creating single-unit dot plots with this free maths worksheet.
- Free Plan
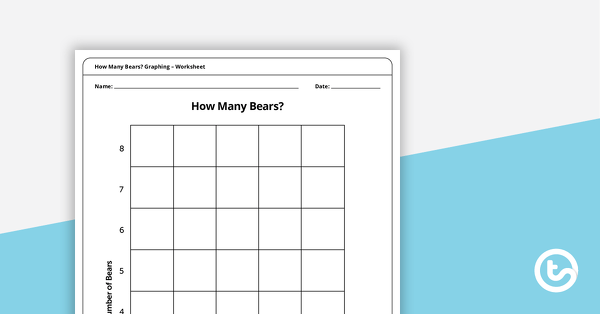
How Many Bears? Graphing – Worksheet
A hands-on picture graph worksheet for students to sort and count coloured bears.
- Plus Plan
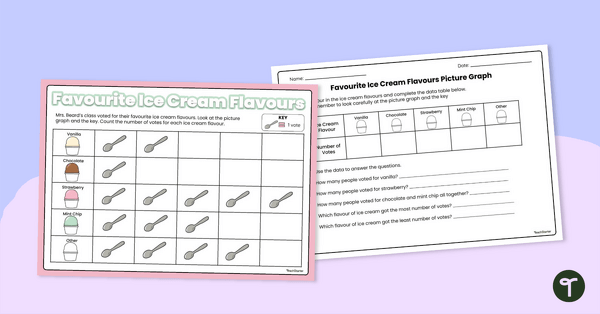
Picture Graphs Worksheet
Use this double-sided worksheet to help your students practise reading and evaluating a simple picture graph.
- Plus Plan
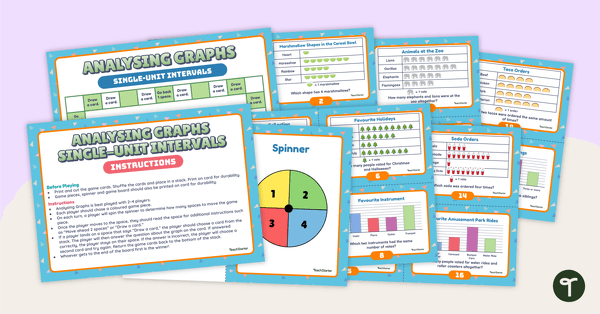
Analysing Graphs (Single-Unit Intervals) Board Game
Sharpen data analysis skills when solving problems with information presented in a single-unit picture or column graph with this board game.
- Plus Plan

Autumn Maths Worksheet - Count and Graph Activity
Use an Autumn Maths Worksheet to practise counting and graphing.
- Plus Plan
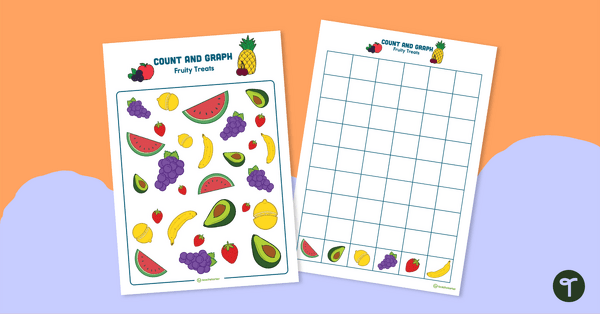
Count and Graph – Fruity Treats
A fruit-themed hands-on activity to introduce graphing skills.
- Plus Plan
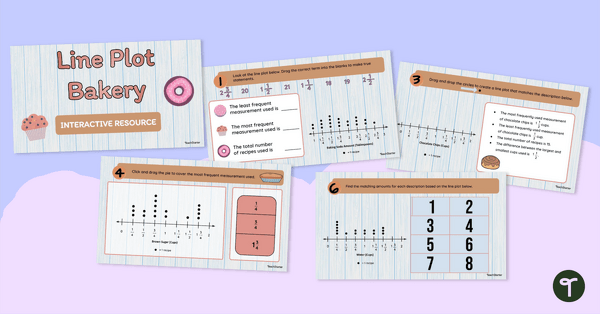
Dot Plot Bakery Interactive Activity
Strengthen dot plot skills with this bakery-themed interactive activity, designed to help students practise creating and analysing dot graphs in a fun, structured way.
- Plus Plan
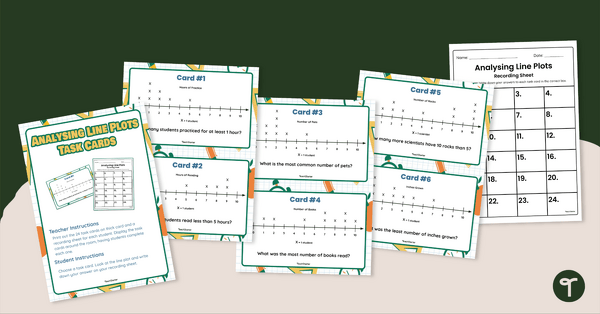
Analysing Dot Plots Task Cards
Strengthen data analysis skills by interpreting dot plots with this set of 24 task cards.
- Plus Plan
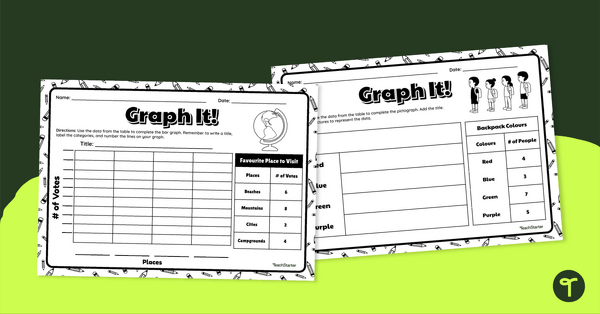
Graph It! Worksheet (Single-Unit Intervals)
Draw a single-unit picture graph and bar graph to represent data with this worksheet.
- Plus Plan
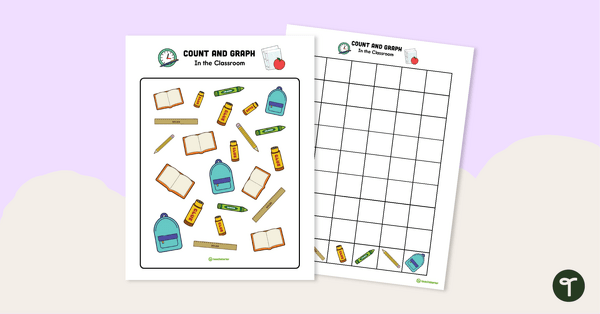
Count and Graph – In the Classroom
Practise collecting, sorting, and organising data to create a graph with this 2-page worksheet.
- Plus Plan
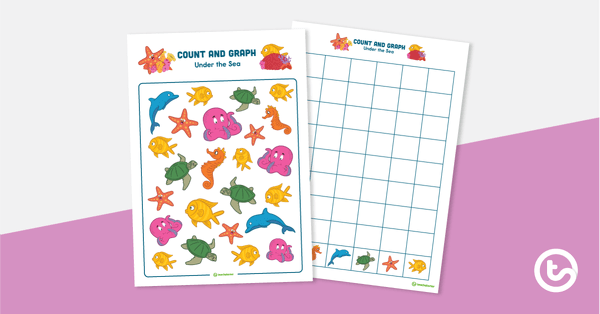
Count and Graph – Under the Sea
A sea-themed hands-on activity to introduce graphing skills.
- Plus Plan
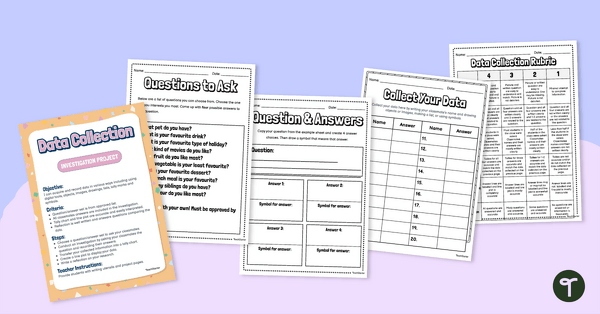
Data Collection Investigation Project
Assign this data collection project to enable students to master the skills of acquiring and recording data.
- Plus Plan
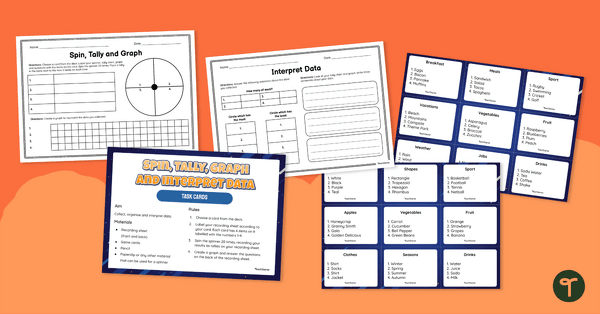
Spin, Tally, Graph and Interpret Data Task Card Activity
Guide your students to collect data, make tally marks, create a column graph and analyse data with this maths activity.
- Plus Plan
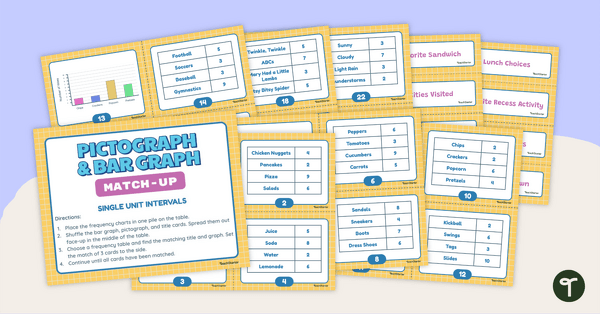
Pictograph and Bar Graph Match-Up (Single-Unit Intervals)
Use data analysis skills to match frequency tables with a corresponding bar graph or pictograph.
- Plus Plan
Picture Graph Playoff – Maths Game
A fun picture graph game for students to consolidate gathering and representing data.
- Plus Plan
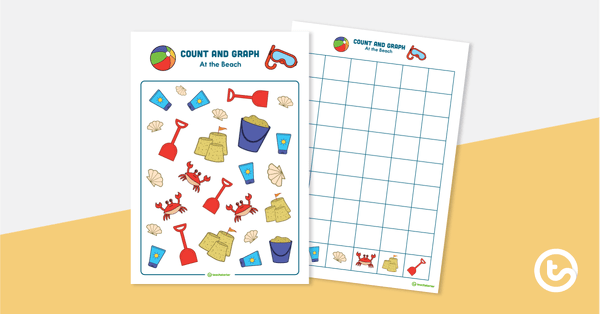
Count and Graph – At the Beach
A beach-themed hands-on activity to introduce graphing skills.
- Plus Plan
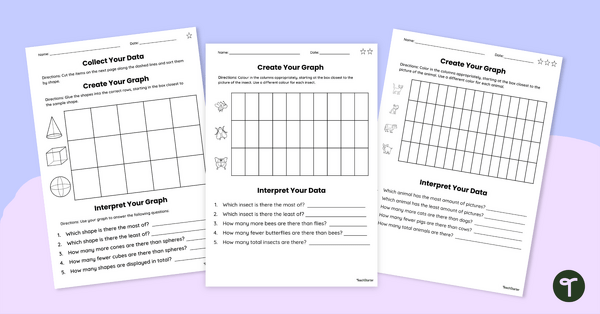
Data Collection Worksheet Set
Use this set of differentiated graphs worksheets to assess your students’ understanding of how data is collected, organised and presented.
- Plus Plan
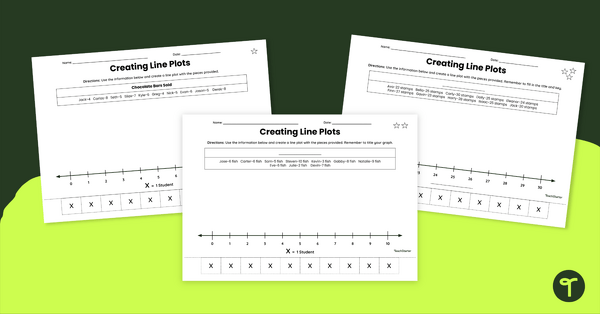
Creating Line Plots Differentiated Cut and Paste Worksheet
Guide students to create line plots with this differentiated cut and paste worksheet.
- Plus Plan
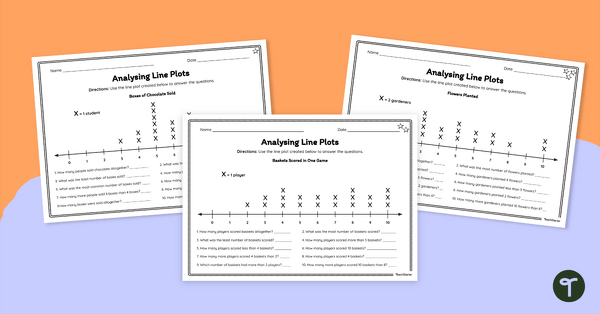
Analysing Line Plots – Differentiated Worksheets
Empower your students to become proficient data interpreters with this set of differentiated line plot worksheets.