Use this engaging worksheet to practice creating and reading pictographs.
Creating Pictographs — Have Students Turn Data into Graphs!
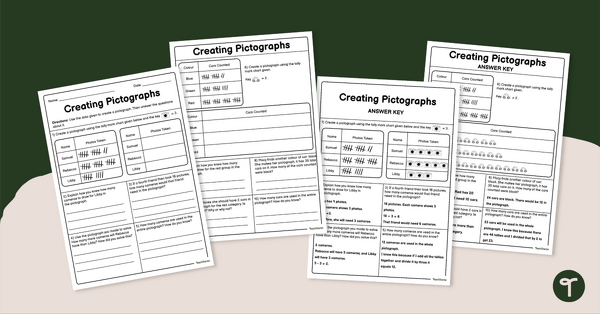
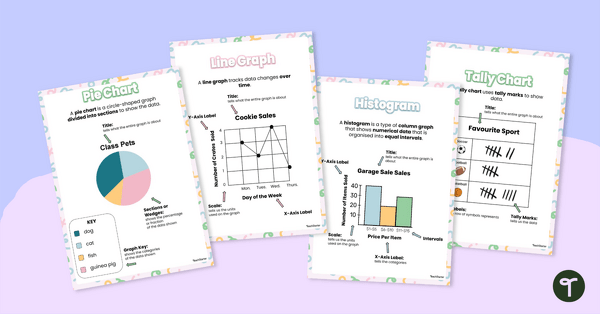
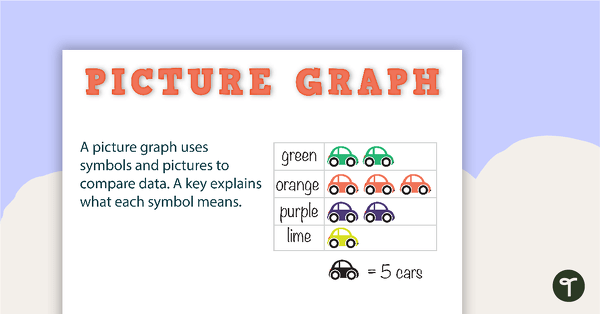
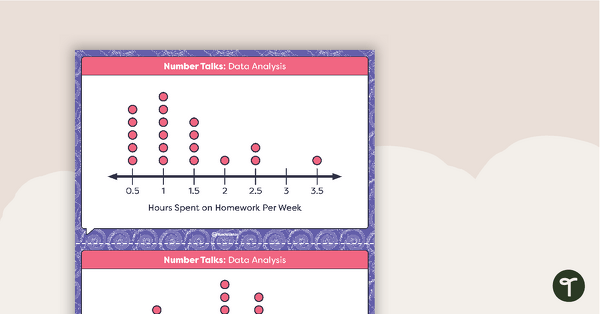
Use this double-sided worksheet to check students’ understanding about how raw data (in this case, recorded as tally marks) can be displayed as a pictograph (or picture graph), and then interpreted to answer a series of related questions.
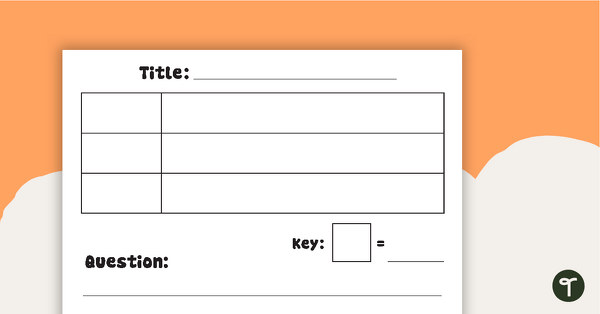
This worksheet set contains a double-sided worksheet and answer key. Each side of the sheet contains instructions for creating a pictograph from the available data, and four word-based problems for students to solve using their own graph.
Tips for Differentiation + Scaffolding
In addition to individual student work time, use this worksheet as a:
- math center or guided group
- lesson exit ticket
- fast finisher activity
- homework assignment
- whole-class review (via smartboard)
Fast finishers may want to move on to creating a bar graph to match the pictograph they made during the exercise.
Students who need extra support can benefit from extra teacher scaffolding to create a tangible pictograph as a group using tape and manipulative materials on the rug.
Easily Download & Print
Use the dropdown icon on the Download button to choose between the PDF or Google Slides version of this resource.
Because this resource includes an answer sheet, we recommend you print one copy of the entire file. Then, make photocopies of the blank worksheet for students to complete.
To save paper, we suggest printing this 2-page worksheet double-sided.
Turn this teaching resource into a sustainable activity by printing it on cardboard and slipping it into a write-and-wipe sleeve. Students can record their answers with a whiteboard marker and then erase and reuse them.
Additionally, project the worksheet onto a screen and work through it as a class by having students record their answers in their notebooks.
This resource was created by Cassandra Friesen, a teacher in Colorado and Teach Starter Collaborator.
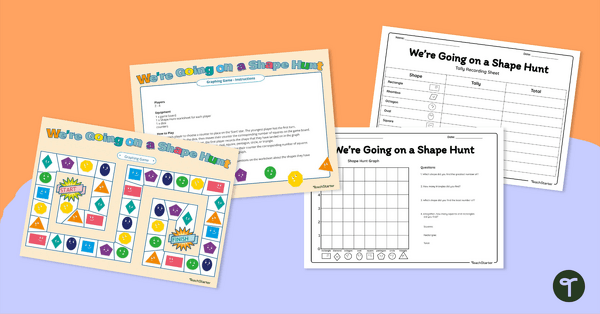
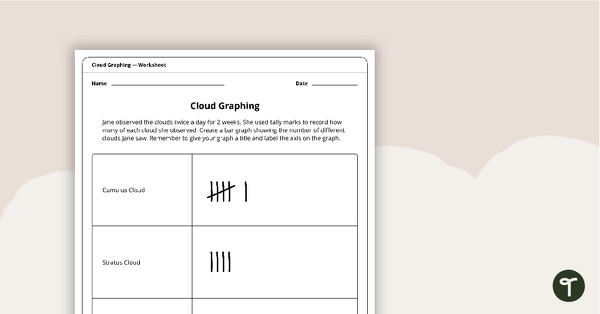
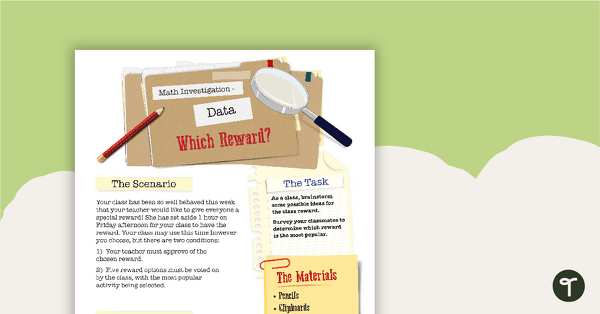
Don’t stop there! We’ve got more activities and resources that cut down on lesson planning time:
[resource:4140014] [resource:4841396] [resource:4842744]


0 Comments
Write a review to help other teachers and parents like yourself. If you'd like to request a change to this resource, or report an error, select the corresponding tab above.