Graphs and Data Teaching Resources
- Free Plan

Chance and Data Maths Investigation - Roll Me a Six!
A mathematics investigation involving chance and data, embedded in a real-world context.
- Plus Plan
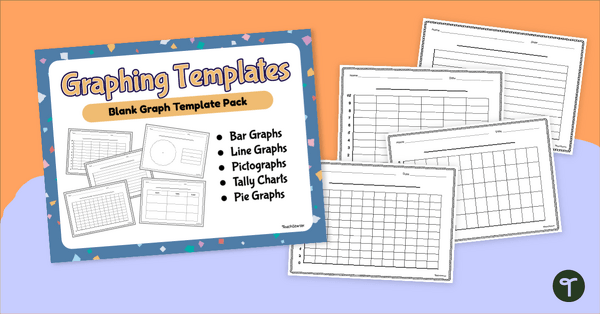
Blank Graph Template Pack
Construct your own graphs with a printable set of Blank Graph Templates.
- Plus Plan
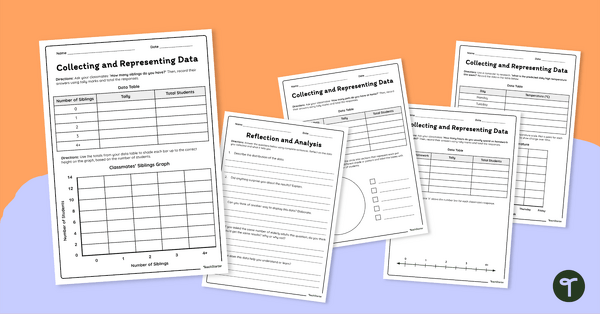
Collecting and Representing Data Worksheet Set
Download our collecting and representing data worksheet set to get your students collecting, organising and displaying data.
- Plus Plan
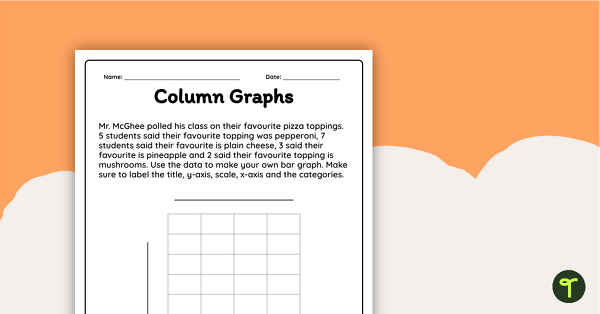
Creating a Bar Graph Worksheet
Interpret data and create a column graph display with this worksheet.
- Plus Plan
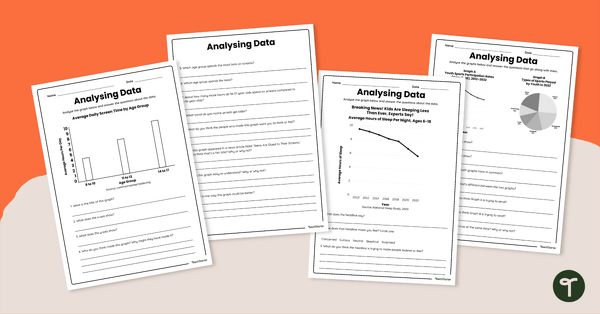
Analysing Data Worksheet Set
Share this analysing data worksheet set with your students to give them varied practice interpreting multiple data representations.
- Plus Plan
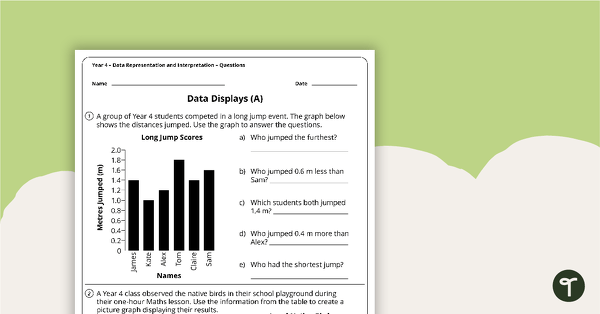
Data Representation and Interpretation Worksheets - Year 4
4 data representation and interpretation worksheets linked to the Australian Curriculum.
- Plus Plan
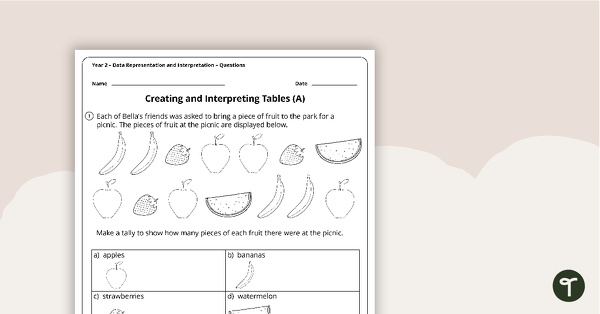
Data Representation and Interpretation Worksheets - Year 2
4 data representation and interpretation worksheets linked to the Australian Curriculum.
- Free Plan
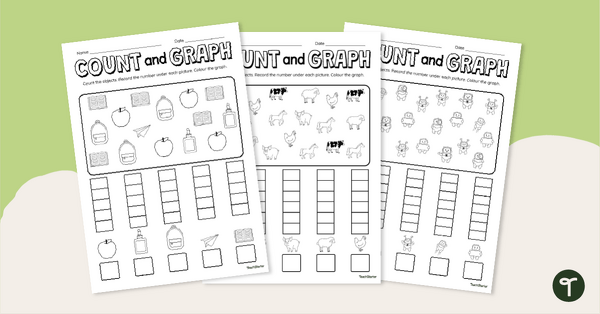
Count and Graph Worksheet Pack
Explore counting and graphing skills with this set of three worksheets.
- Plus Plan
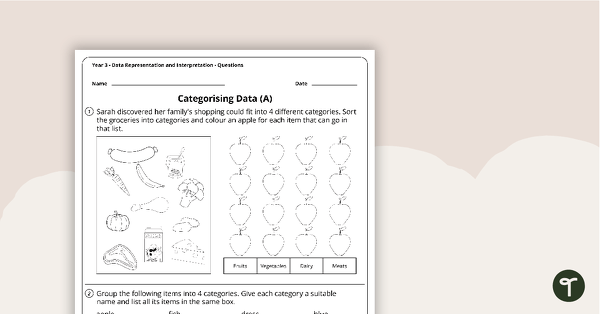
Data Representation and Interpretation Worksheets - Year 3
8 data representation and interpretation worksheets linked to the Australian Curriculum.
- Plus Plan
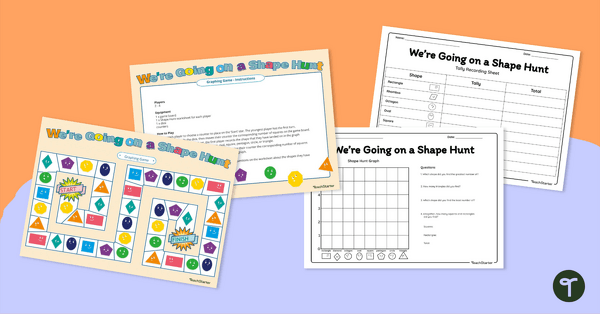
We're Going On a Shape Hunt! Graphing Game
Consolidate students' knowledge of 2D shapes while teaching about data collection, recording and graphing!
- Plus Plan
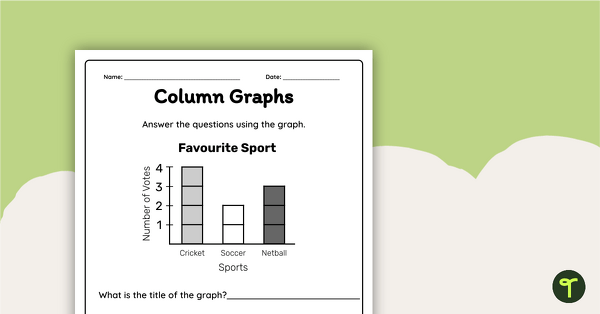
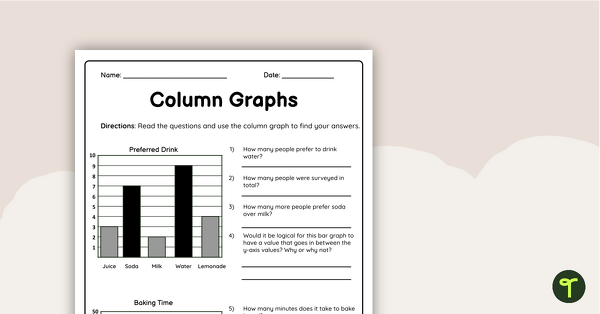
Interpreting a Column Graph Worksheet
Interpret information from a column graph and answer questions with this worksheet.
- Plus Plan
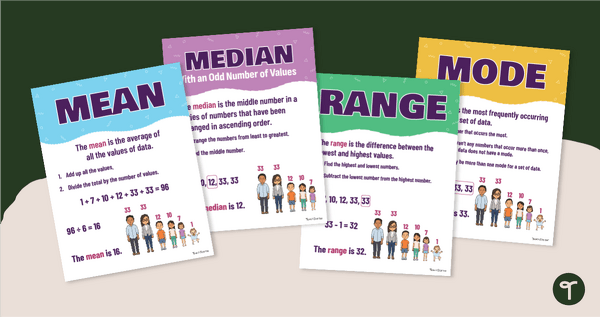
Mean, Median, Mode & Range Poster Pack
Download a Mean, Median, Mode & Range poster pack to help your students remember measures of central tendency.
- Plus Plan
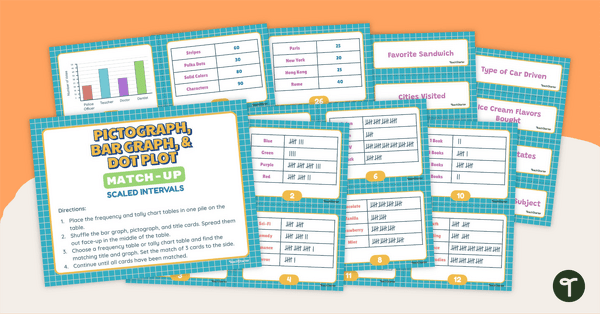
Pictograph, Bar Graph and Dot Plot Match-Up (Scaled Intervals)
Use data analysis skills to match tally charts and frequency tables with their corresponding bar graph, pictograph, or dot plot.
- Plus Plan

Data Representation and Interpretation Worksheets - Year 6
8 data representation and interpretation worksheets linked to the Australian Curriculum.
- Plus Plan
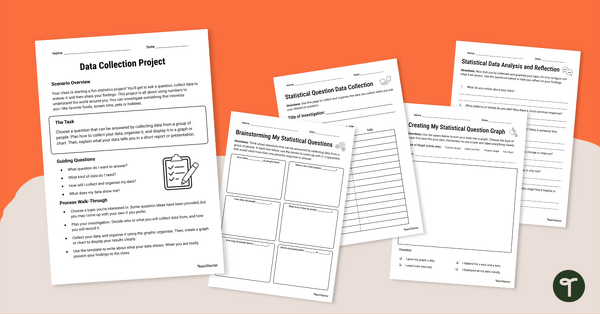
Data Collection Project
Complete this data collection project with your students to give them practise developing a statistical question, collecting data and displaying the results.
- Plus Plan
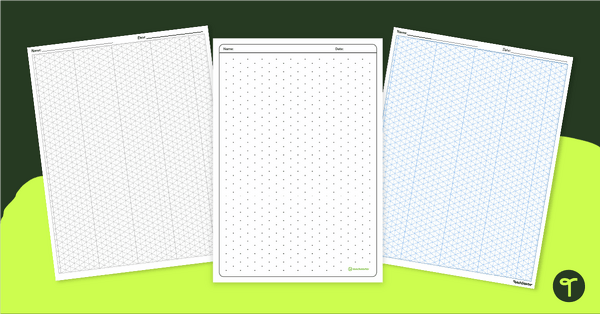
Isometric Drawing Paper - Dotty & Lined
Take your maths and design lessons to the next dimension with our collection of isometric drawing paper templates!
- Plus Plan
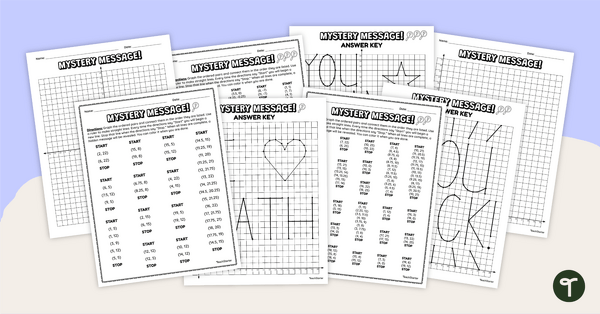
Cartesian Plane Mystery Pictures
Practise graphing on the Cartesian plane with this set of differentiated mystery pictures.
- Plus Plan

Data Maths Investigation - Which Reward?
A mathematics investigation involving data collection and representation, embedded in a real-world context.
- Plus Plan

Types of Graphs Posters
Show students the varying data displays they will encounter in their primary maths lessons with these colourful and easy-to-digest visual posters.
- Plus Plan
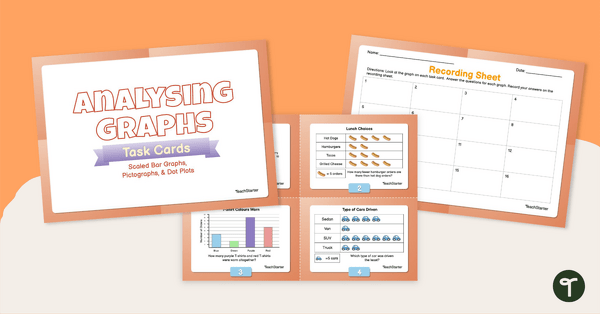
Analysing Graphs — Scaled Bar Graphs, Pictographs, & Dot Plots —Task Cards
Use data analysis skills to analyse scaled bar graphs, pictographs, and dot plots with this set of task cards.
- Plus Plan
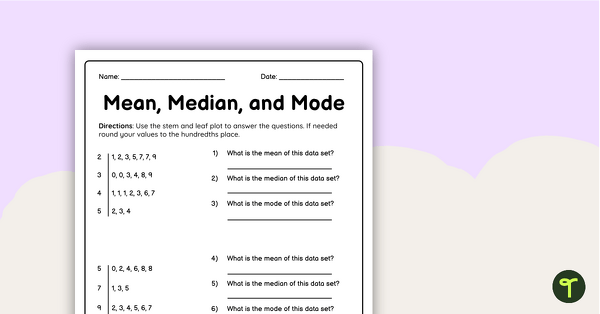
Mean Median Mode Worksheet
Use this double-sided worksheet to check students’ ability to find the mean, median and mode of given data sets.
- Free Plan

Picture Graph Templates
A set of blank picture graph templates for students to represent data.
- Free Plan
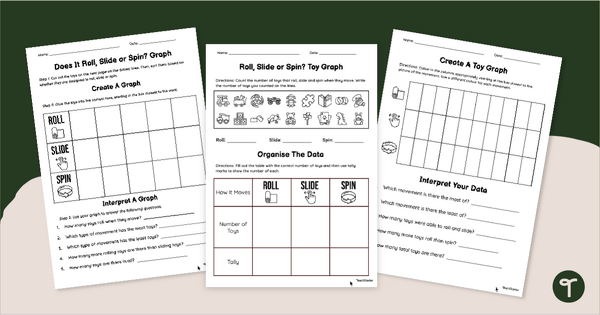
How Does It Move? Toy Graphing Worksheets
Explore motion and mathematics with engaging Toy Graphing Worksheets.
- Plus Plan
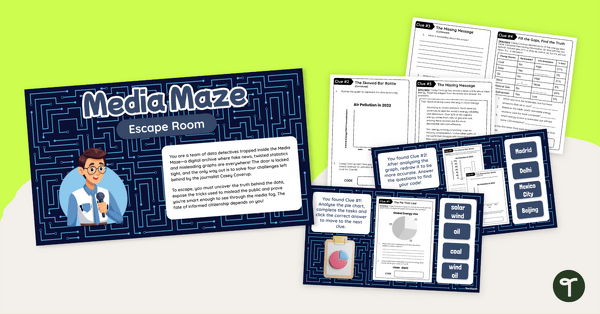
Interpreting Data Year 6 Escape Room
Play our interpreting data year 6 escape room to give your students engaging practise identifying and correcting misleading data displays.
- Plus Plan
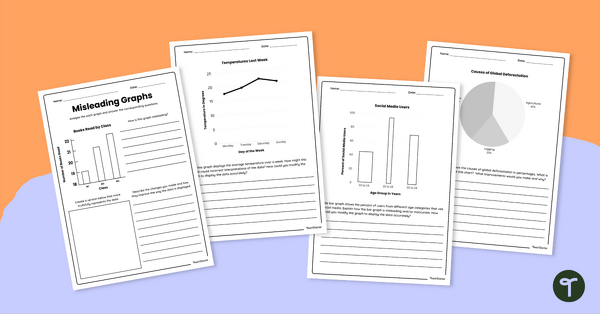
Misleading Graphs Worksheet Set
Download our misleading graphs worksheet set to increase your students’ abilities in statistical literacy and data analysis.
- Plus Plan
Column Graphs Grade 5 Worksheet
Use this double-sided column graphs worksheet to check your students’ understanding of interpreting and drawing column graphs.
- Plus Plan
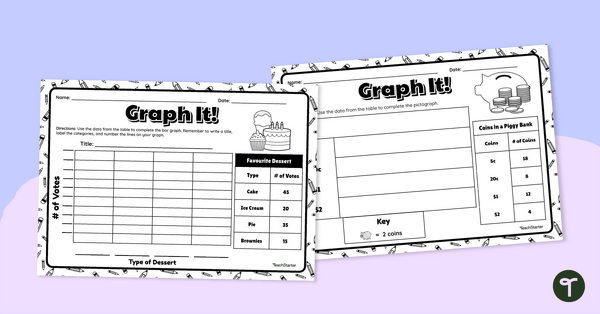
Graph It! Worksheet (Many-to-One Graphs)
Draw a scaled picture graph and bar graph to represent data with this worksheet.
- Plus Plan
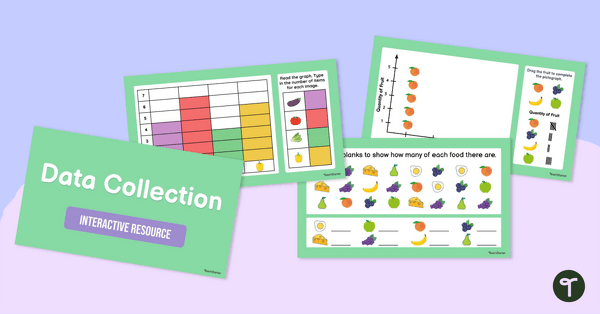
Data Collection Interactive Activity
Check your students’ understanding of interpreting data and using it to create graphs using this fun and colourful interactive game.
- Plus Plan
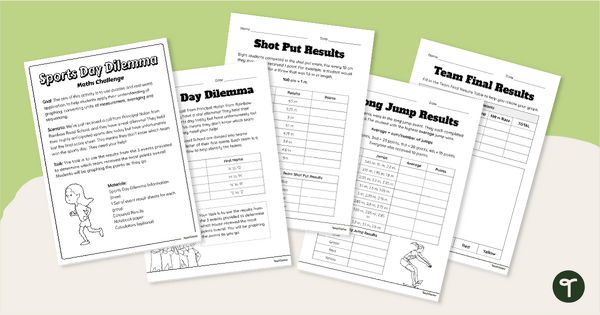
Sports Day Dilemma - Metric Conversions Maths Task
Engage students with a real-world application of measurement conversions with Sports Day Dilemma, a metric conversion maths task!
- Plus Plan
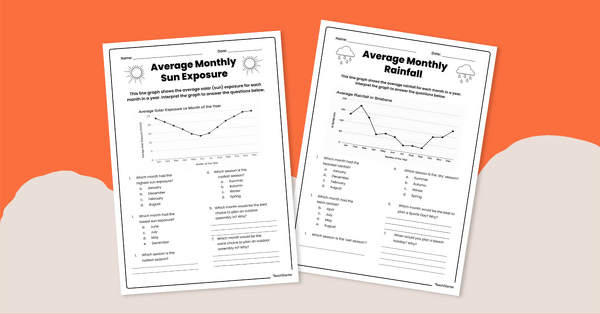
Interpreting Line Graphs Worksheet Pack
Use this set of 4 Grade 5 worksheets to help students practise interpreting real-life data represented as a line graph.
- Free Plan
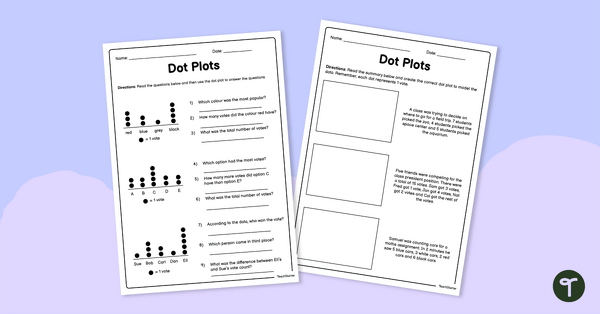
Dot Plot Worksheet
Practise analysing and creating single-unit dot plots with this free maths worksheet.
- Plus Plan
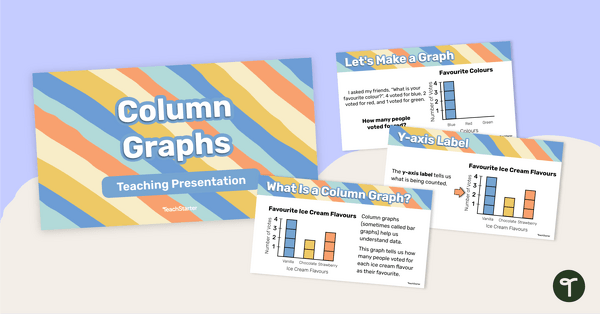
Column Graphs – Teaching Presentation
Learn all the features and how to construct a column graph with this 25-page teaching presentation.