Graphs and Data Worksheets for Teachers
- Plus Plan
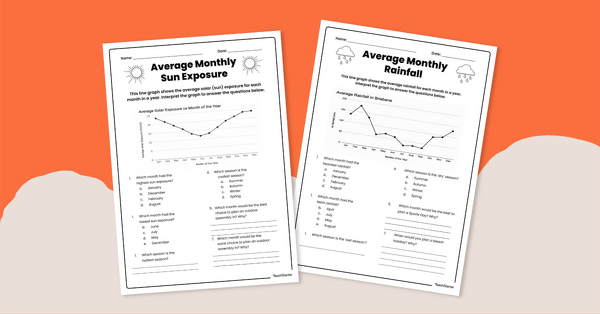
Interpreting Line Graphs Worksheet Pack
Use this set of 4 Grade 5 worksheets to help students practise interpreting real-life data represented as a line graph.
- Plus Plan
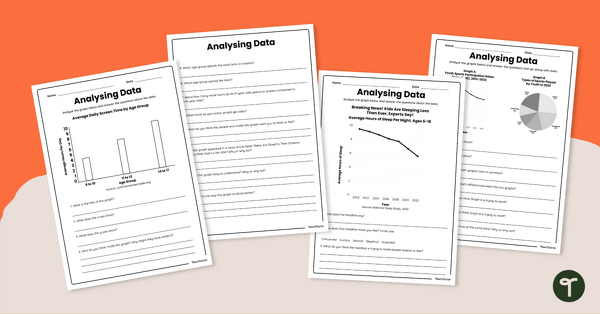
Analysing Data Worksheet Set
Share this analysing data worksheet set with your students to give them varied practice interpreting multiple data representations.
- Plus Plan
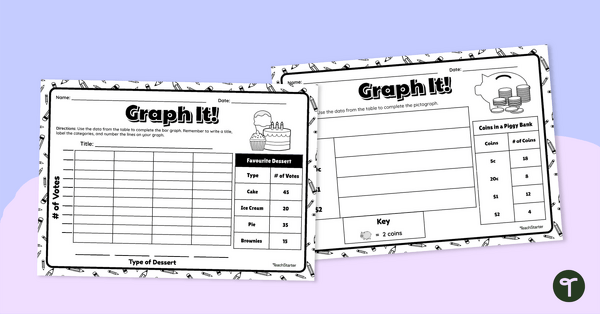
Graph It! Worksheet (Many-to-One Graphs)
Draw a scaled picture graph and bar graph to represent data with this worksheet.
- Plus Plan
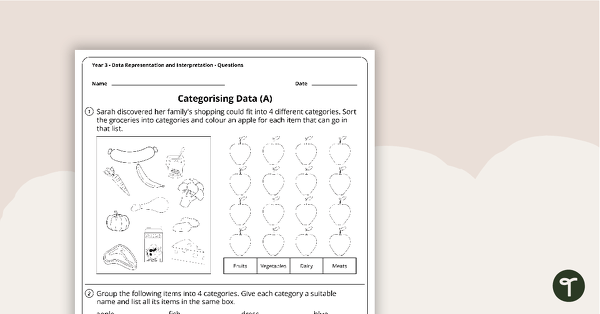
Data Representation and Interpretation Worksheets - Year 3
8 data representation and interpretation worksheets linked to the Australian Curriculum.
- Plus Plan
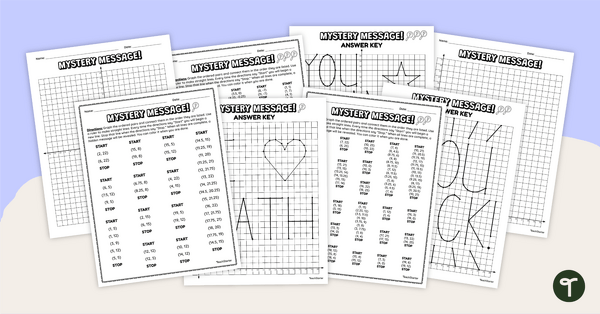
Cartesian Plane Mystery Pictures
Practise graphing on the Cartesian plane with this set of differentiated mystery pictures.
- Plus Plan
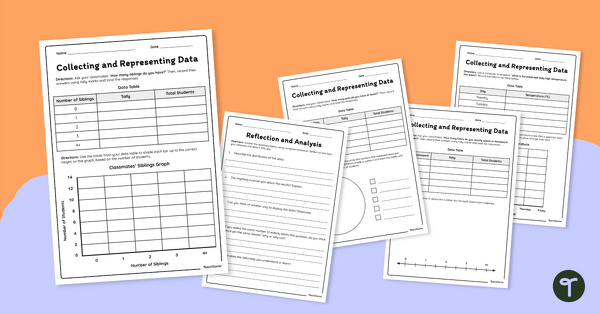
Collecting and Representing Data Worksheet Set
Download our collecting and representing data worksheet set to get your students collecting, organising and displaying data.
- Plus Plan
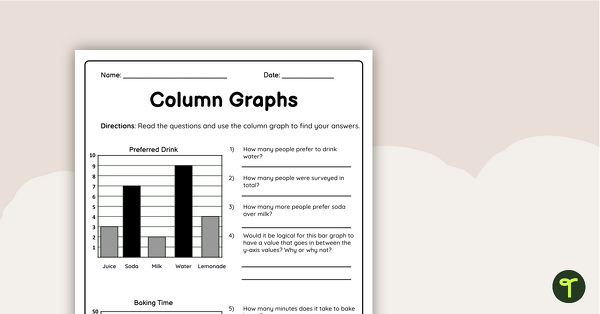
Column Graphs Grade 5 Worksheet
Use this double-sided column graphs worksheet to check your students’ understanding of interpreting and drawing column graphs.
- Free Plan
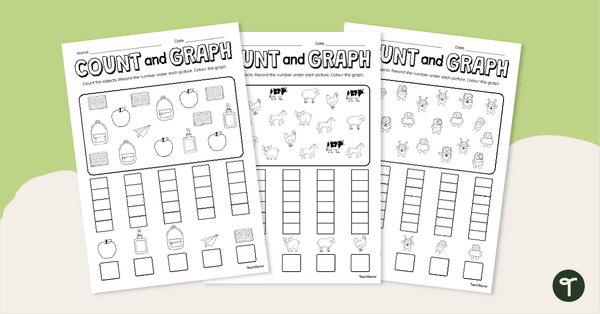
Count and Graph Worksheet Pack
Explore counting and graphing skills with this set of three worksheets.
- Free Plan
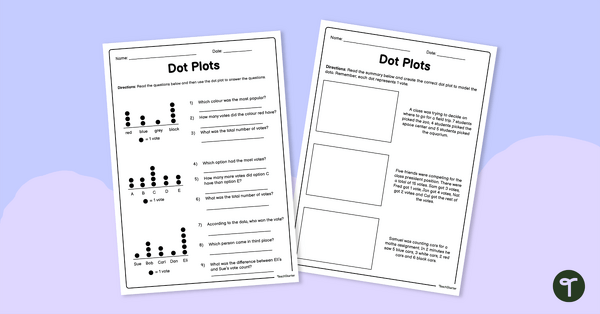
Dot Plot Worksheet
Practise analysing and creating single-unit dot plots with this free maths worksheet.
- Plus Plan
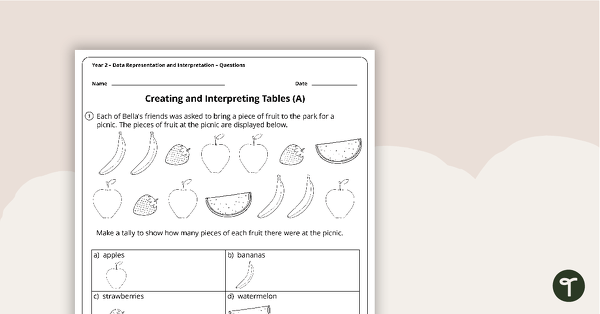
Data Representation and Interpretation Worksheets - Year 2
4 data representation and interpretation worksheets linked to the Australian Curriculum.
- Plus Plan
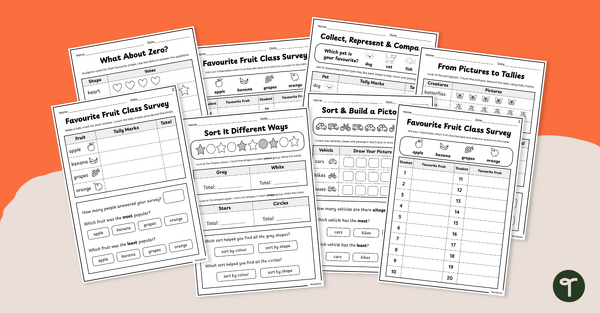
Collecting and Organising Data Worksheet Pack
Introduce students to the world of data and graphing with this engaging worksheet pack.
- Plus Plan
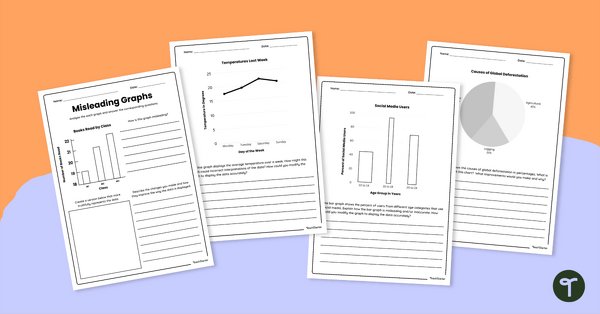
Misleading Graphs Worksheet Set
Download our misleading graphs worksheet set to increase your students’ abilities in statistical literacy and data analysis.
- Plus Plan
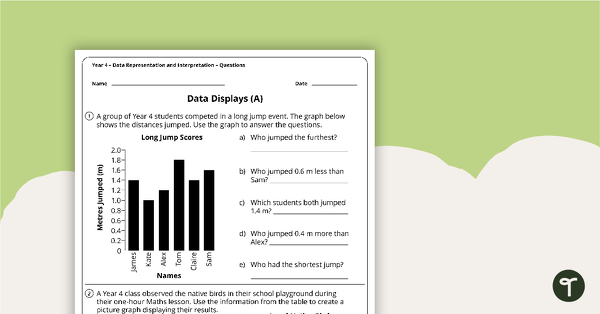
Data Representation and Interpretation Worksheets - Year 4
4 data representation and interpretation worksheets linked to the Australian Curriculum.
- Plus Plan
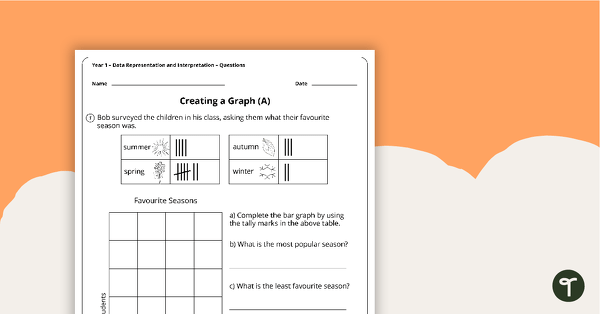
Data Representation and Interpretation Worksheets - Year 1
Two data representation and interpretation worksheets linked to the Australian Curriculum.
- Plus Plan
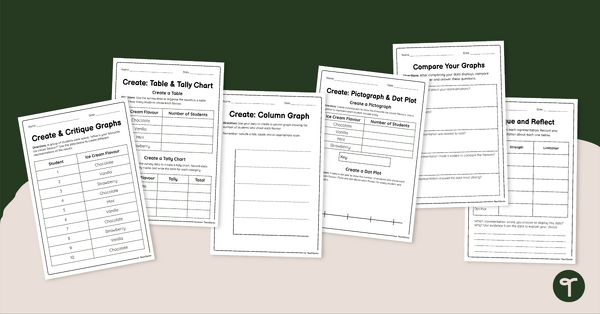
Year 4 Create and Critique - Comparing Graphs Worksheet Pack
Use this graph comparing worksheet activities to help students create, analyse and compare different data displays.
- Plus Plan
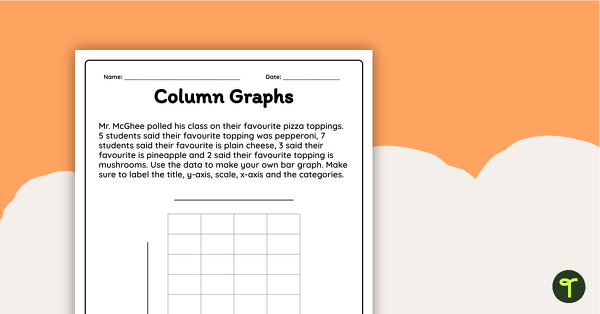
Creating a Bar Graph Worksheet
Interpret data and create a column graph display with this worksheet.
- Free Plan
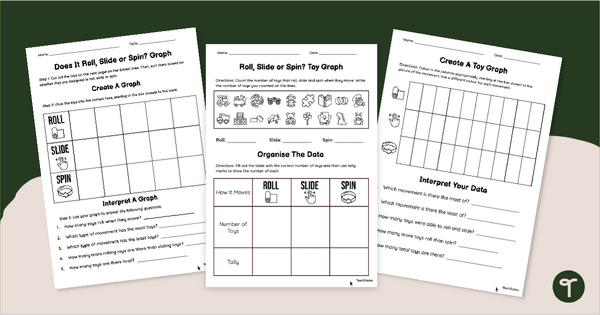
How Does It Move? Toy Graphing Worksheets
Explore motion and mathematics with engaging Toy Graphing Worksheets.
- Free Plan
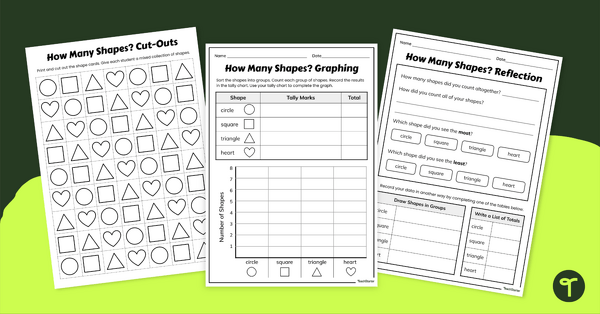
How Many Shapes? Graphing Activity
Develop early graphing skills with this engaging graphing worksheet pack, designed to help students sort, count and organise data while creating graphs using hands-on shape activities.
- Plus Plan
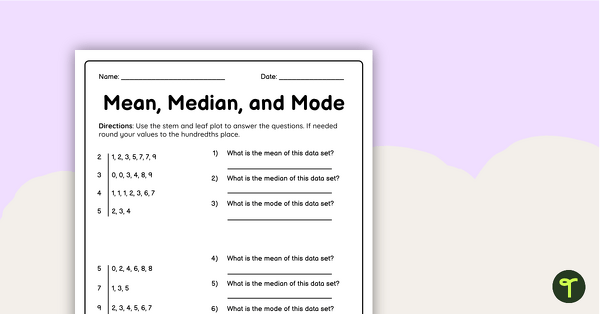
Mean Median Mode Worksheet
Use this double-sided worksheet to check students’ ability to find the mean, median and mode of given data sets.
- Plus Plan
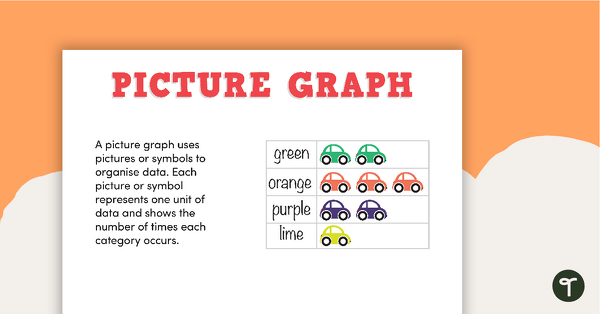
Types of Graphs Posters and Worksheets
A collection of posters displaying the different types of graphs along with matching worksheets to assist students with laying out graphs on the page.
- Plus Plan
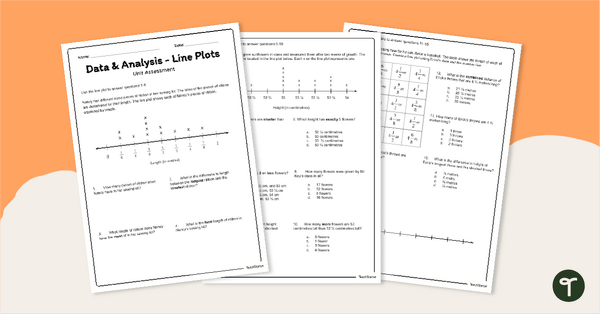
Line Plots / Dot Plots - Year 5 Assessment
Assess student understanding of reading and creating dot plots/line plots with a printable assessment for Year 5.
- Plus Plan
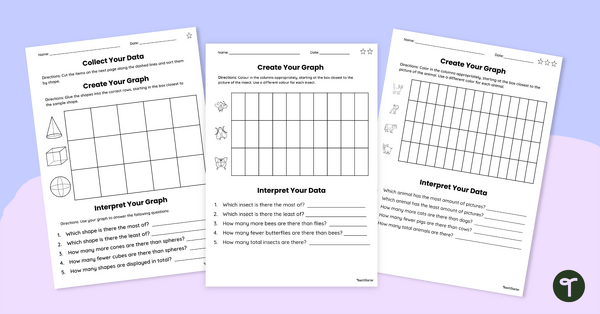
Data Collection Worksheet Set
Use this set of differentiated graphs worksheets to assess your students’ understanding of how data is collected, organised and presented.
- Plus Plan
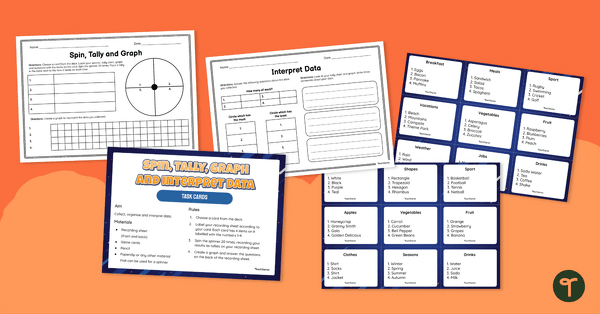
Spin, Tally, Graph and Interpret Data Task Card Activity
Guide your students to collect data, make tally marks, create a column graph and analyse data with this maths activity.
- Plus Plan
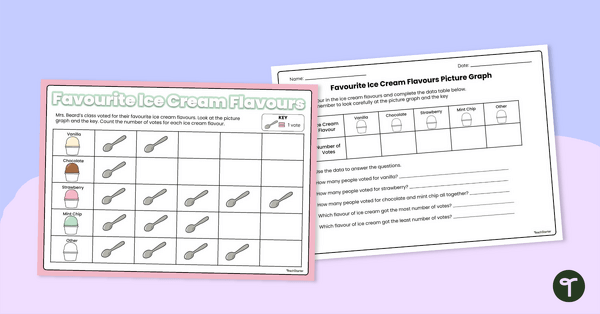
Picture Graphs Worksheet
Use this double-sided worksheet to help your students practise reading and evaluating a simple picture graph.
- Plus Plan
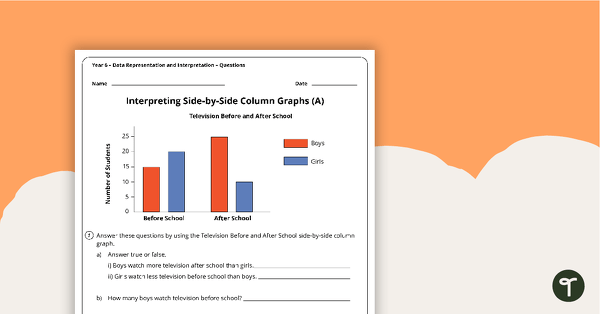
Data Representation and Interpretation Worksheets - Year 6
8 data representation and interpretation worksheets linked to the Australian Curriculum.
- Plus Plan
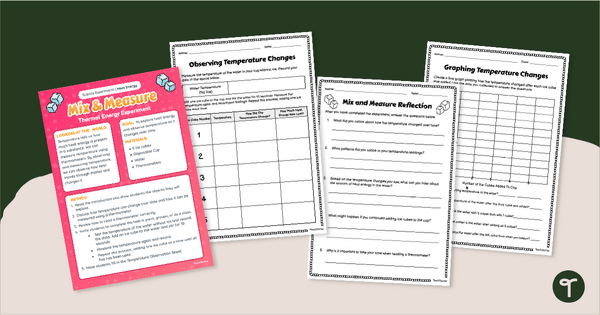
Mix & Measure Temperature Experiment
Explore temperature changes and practise reading a thermometer with our Mix and Measure Temperature Experiment.
- Plus Plan
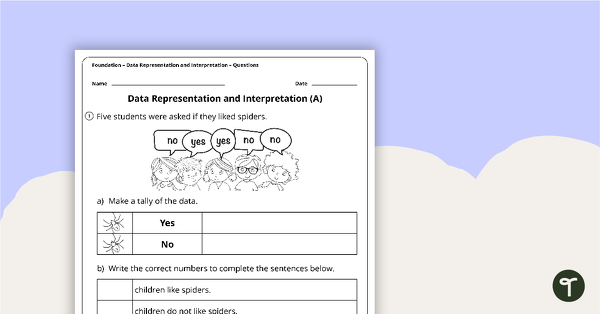
Data Representation and Interpretation Worksheets - Foundation
2 data representation and location worksheets linked to the Australian Curriculum.
- Plus Plan
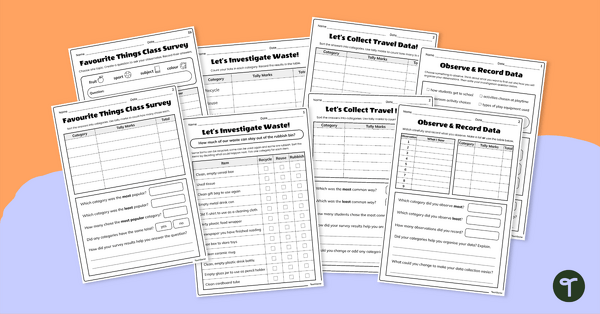
Data and Graphs Worksheet Pack — Year 2
Support students as they develop data literacy skills with this engaging worksheet pack focused on collecting, organising and interpreting information.
- Plus Plan
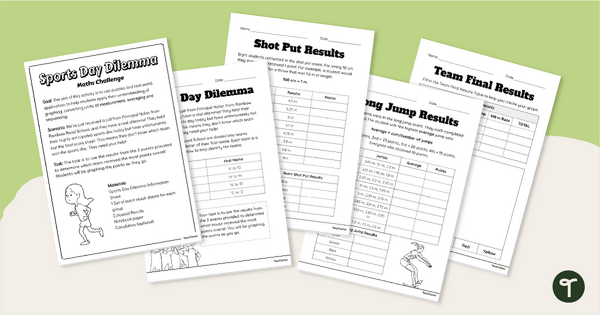
Sports Day Dilemma - Metric Conversions Maths Task
Engage students with a real-world application of measurement conversions with Sports Day Dilemma, a metric conversion maths task!
- Plus Plan
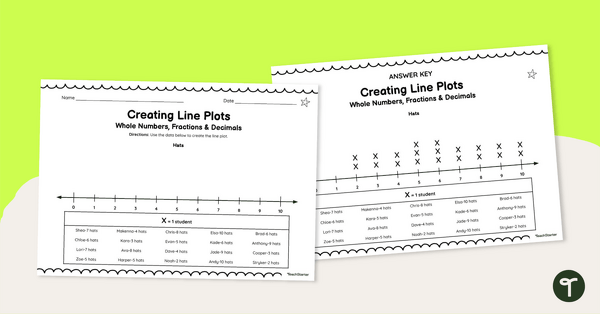
Creating Line Plots (With Whole Numbers, Fractions and Decimals) Worksheets
Help your students master data representation with this series of leveled worksheets for creating line plots.
- Plus Plan
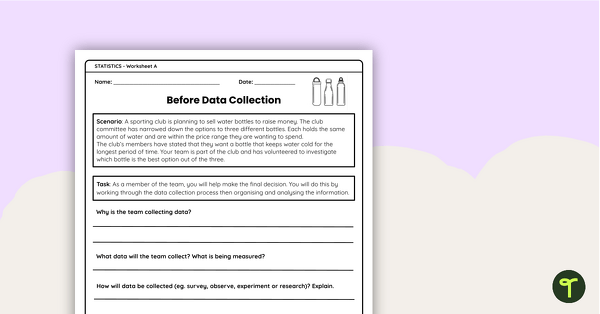
Interpreting Line Graphs Grade 5 Worksheet Set
- Free Plan
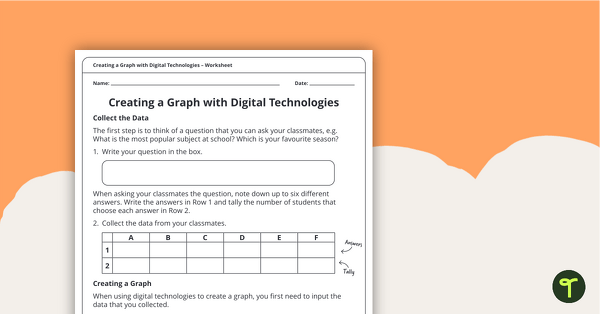
Creating a Graph Using Digital Technologies
A worksheet that supports students when collecting initial data and creating a digital graph.