Practice analyzing and creating single-unit dot plots with this free math worksheet for 2nd-grade students.
What Is a Dot Plot?
A dot plot is a simple and effective way to visually represent data. It is a type of data visualization that displays individual data points on a number line. Each data point is represented by a dot placed above its corresponding value on the number line.
Looking For Math Worksheets for 2nd Grade?
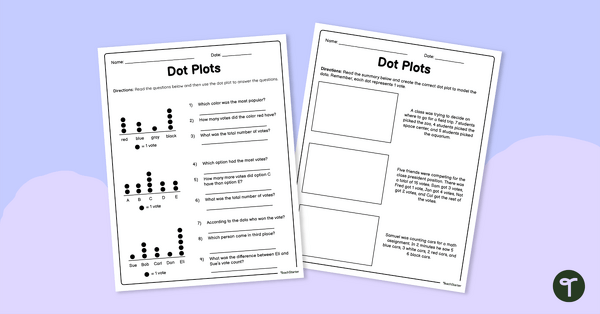
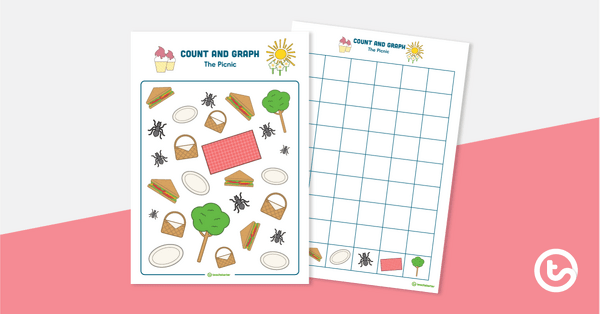
Introducing our comprehensive Dot Plot Mastery Worksheet, a downloadable resource that will elevate your students’ understanding of dot plots to new heights! This double-sided worksheet will give your students ample practice with analyzing and creating single-unit dot plots.
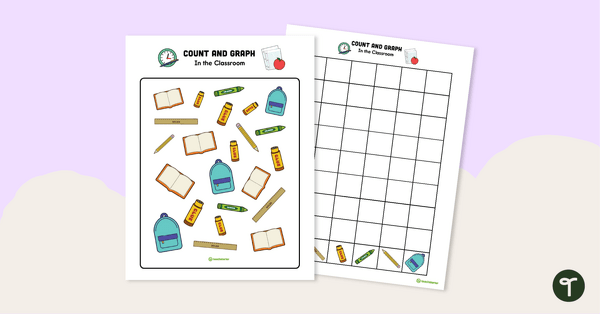
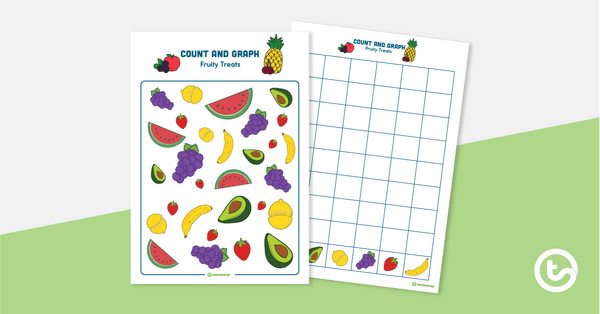
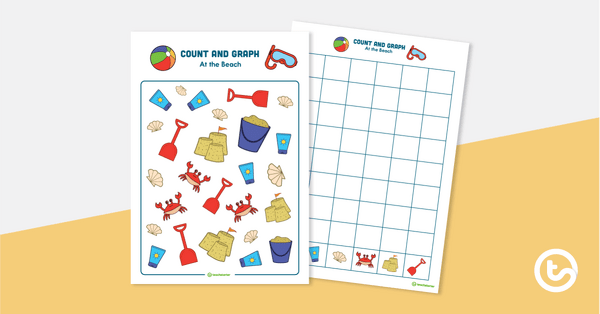
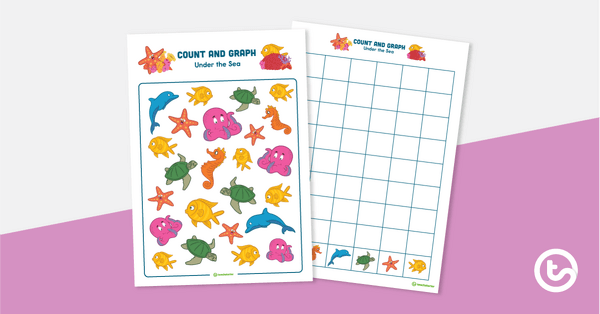
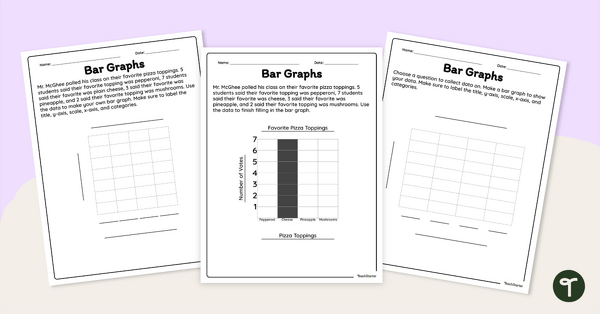
On the front side of the worksheet, students will encounter three distinct dot plots, each depicting data in an easy-to-understand manner. Through carefully curated questions, students will dive into data analysis, honing their skills in interpreting dot plots.
The back side of the worksheet offers an exciting opportunity for students to put their newfound knowledge into practice. Here, they will be tasked with creating their own dot plots for three different sets of data.
An answer key is included with your download to make grading fast and easy!
Tips for Differentiation + Scaffolding
For students who need an added challenge, encourage them to collect their data and create a scaled dot plot where each dot represents more than one.
If students need additional support, encourage them to count each dot and place a number at the top of each column to help remind them of the values for each category.
Easily Download & Print Your Dot Plot Worksheet
The Download button has a dropdown icon, which allows you to choose between the PDF and Google Slides versions of this resource.
Because this resource includes an answer sheet, we recommend you print one copy of the entire file. Then, make photocopies of the blank worksheet for students to complete.
To save paper, we suggest printing this 2-page worksheet double-sided.
Turn this teaching resource into a sustainable activity by printing on cardstock and slipping it into a dry erase sleeve. Students can record their answers with a whiteboard marker and then erase and reuse them.
Additionally, project the worksheet onto a screen and work through it as a class by having students record their answers in their notebooks.
This resource was created by Cassandra Friesen, a teacher in Colorado and a Teach Starter Collaborator.
Don’t stop there! We’ve got more activities to shorten your lesson planning time:
teaching resource
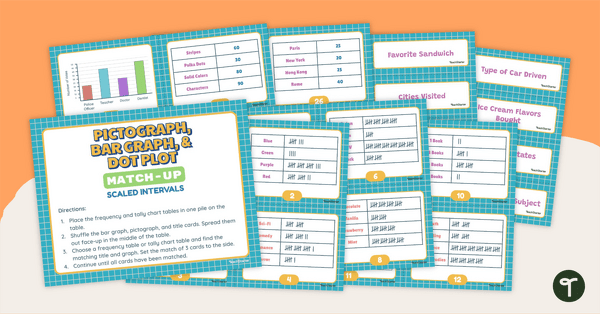
Pictograph, Bar Graph, & Dot Plot Match-Up (Scaled Intervals)
Use data analysis skills to match tally charts and frequency tables with their corresponding bar graph, pictograph, or dot plot.
teaching resource
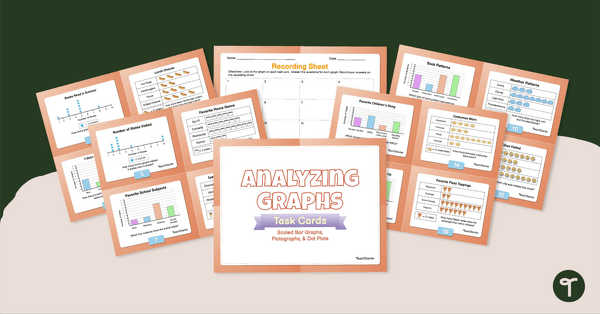
Analyzing Graphs — Scaled Bar Graphs, Pictographs, & Dot Plots —Task Cards
Use data analysis skills to analyze scaled bar graphs, pictographs, and dot plots with this set of task cards.
teaching resource
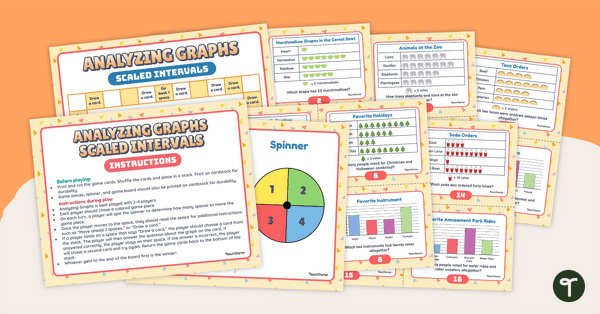
Analyzing Graphs (Scaled Intervals) – Board Game
Use this board game to sharpen data analysis skills when solving problems with information presented in a scaled picture graph and bar graph.


0 Comments
Write a review to help other teachers and parents like yourself. If you'd like to request a change to this resource, or report an error, select the corresponding tab above.