Statistics
- Plus Plan

Types of Graphs Posters and Worksheets
A collection of posters displaying the different types of graphs along with matching worksheets to assist students with laying out graphs on the page.
- Plus Plan
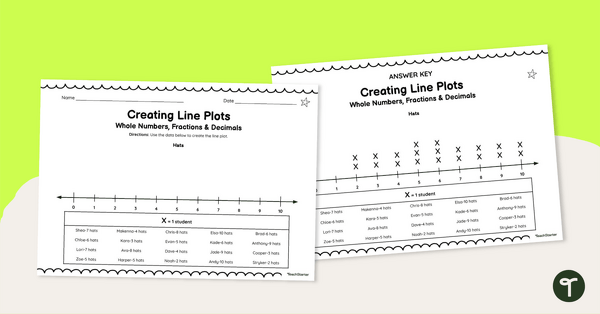
Creating Line Plots (With Whole Numbers, Fractions and Decimals) Worksheets
Help your students master data representation with this series of leveled worksheets for creating line plots.
- Plus Plan
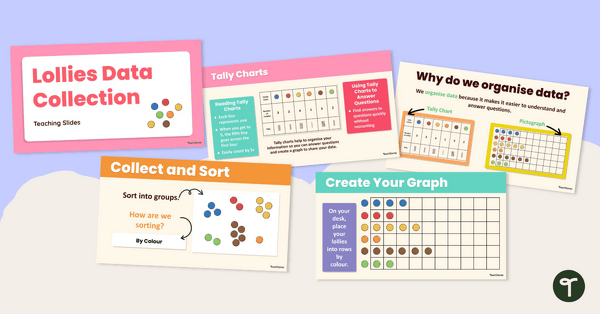
Lollies Data Collection Instructional Slide Deck
Explore this sweet-themed data collection teaching presentation to teach students the basics of acquiring and recording data.
- Plus Plan
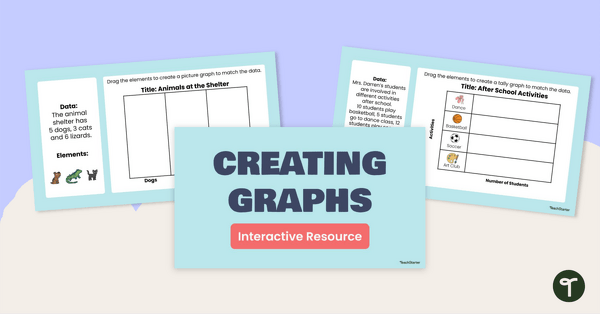
Creating Graphs Interactive Activity
Share this interactive activity with your students to help them practise using digital tools to create graphs from raw data.
- Plus Plan
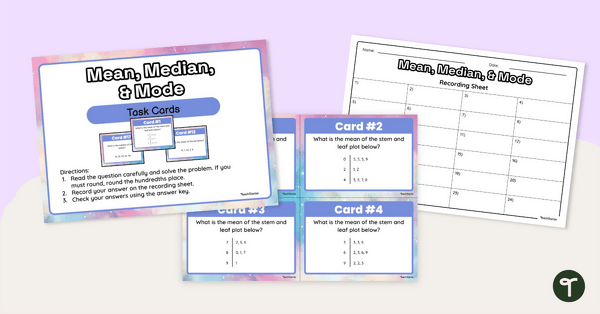
Mean Median and Mode Task Cards
Use this set of 24 data interpretation task cards to teach students to find the mean, median and mode of a limited data set.
- Plus Plan

Analysing Graphs – Single-Unit Bar Graphs and Pictographs – Task Cards
Use data analysis skills to analyse bar graphs and pictographs with this set of task cards.
- Plus Plan
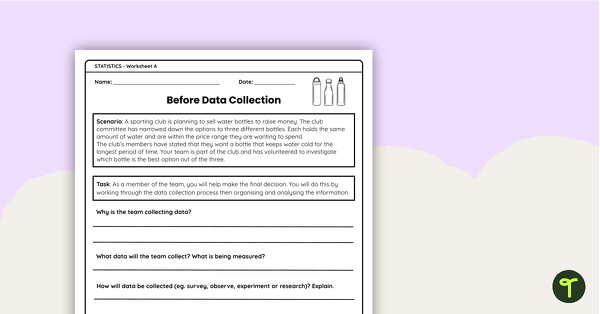
Survey Data Collection Worksheets
A set of worksheets for students to plan survey parameters and tally data.
- Plus Plan
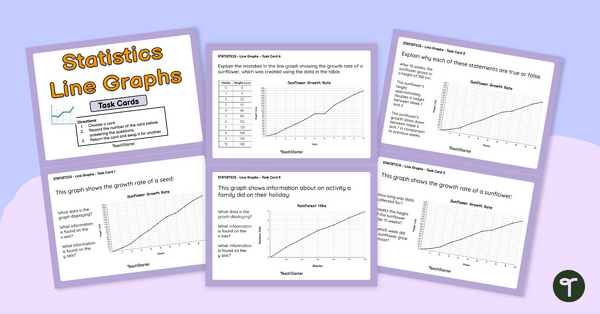
Interpreting Line Graphs Task Cards Grade 5
Use these task cards in your maths class to have students independently analyse and interpret line graphs.
- Plus Plan
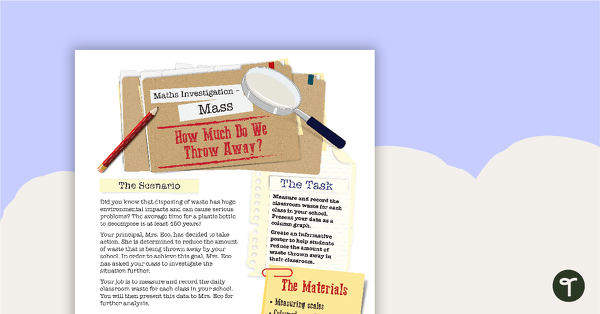
Mass Maths Investigation - How Much Do We Throw Away?
A mathematics investigation about measuring mass, embedded in a real-world context.
- Plus Plan
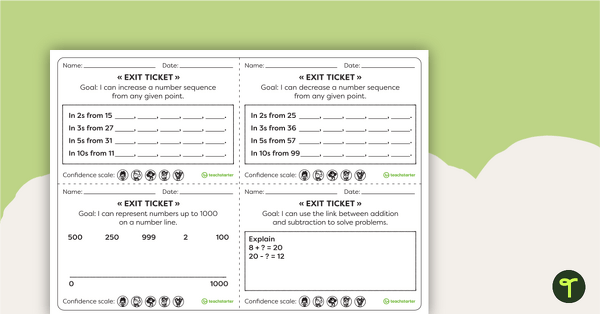
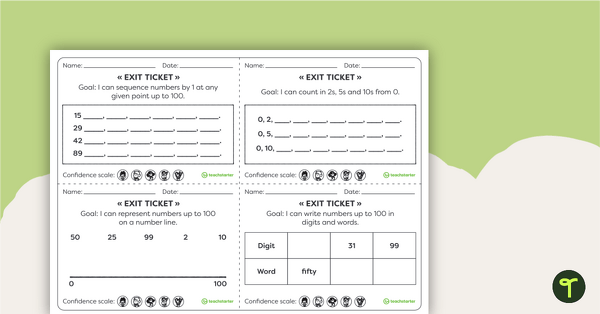
Year 2 Numeracy Exit Tickets – Worksheets
35 Numeracy Exit Ticket activities for students to provide evidence of their learning progress.
- Plus Plan
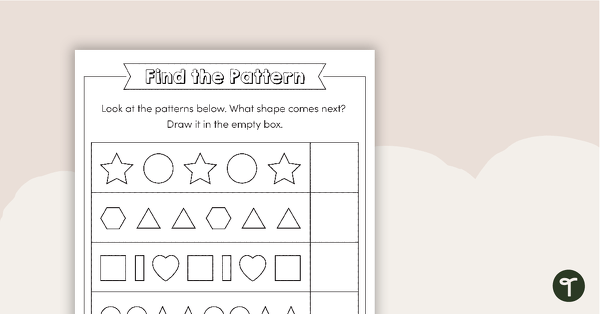
Find the Pattern Worksheet
A worksheet to assist early learners in recognising patterns.
- Plus Plan
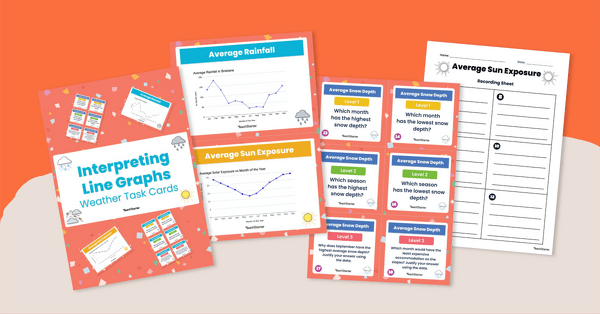
Interpreting Line Graphs Task Cards
Engage your Grade 5 learners with this task card set focused on interpreting line graphs.
- Free Plan

Picture Graph Templates
A set of blank picture graph templates for students to represent data.
- Plus Plan
Maths Warm-Ups Interactive PowerPoint – Year 4
A PowerPoint providing a series of warm up activities for Year 4 students across the Mathematics curriculum.
- Plus Plan
Year 1 Numeracy Exit Tickets – Worksheets
18 Numeracy Exit Ticket activities for students to provide evidence of their learning progress.
- Plus Plan

Maths Warm Ups Interactive PowerPoint - Year 2
A PowerPoint providing a series of warm up activities for Year 2 students across the curriculum.
- Plus Plan
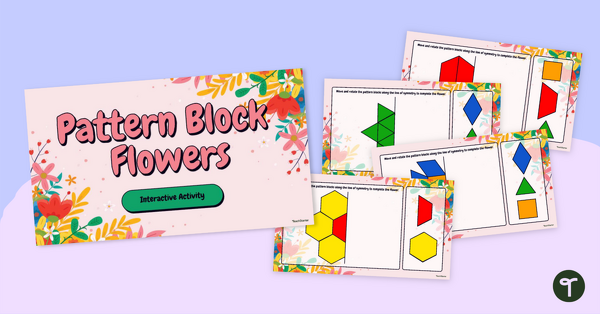
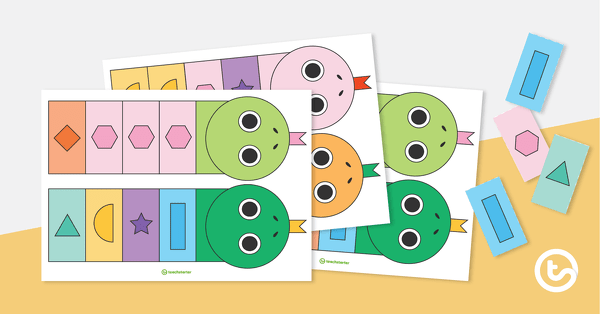
Pattern Block Flowers Interactive
Use this flower-themed interactive activity for your students to practise using manipulatives to create or expand on shapes using a pattern or symmetry model.
- Plus Plan
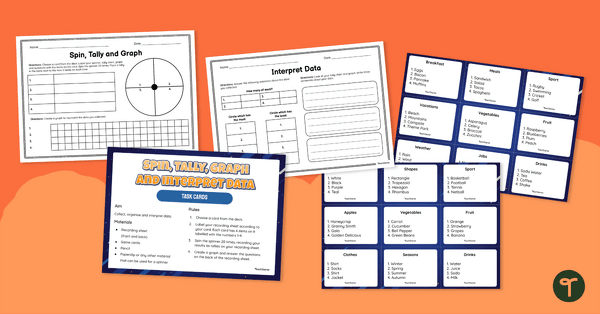
Spin, Tally, Graph and Interpret Data Task Card Activity
Guide your students to collect data, make tally marks, create a column graph and analyse data with this maths activity.
- Plus Plan
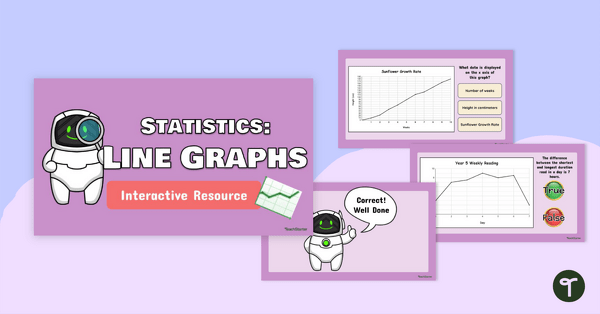
Interpreting Line Graphs Interactive Activity Grade 5
Solve the space man's line graph questions and complete the challenge with this interpreting line graphs interactive game!
- Plus Plan
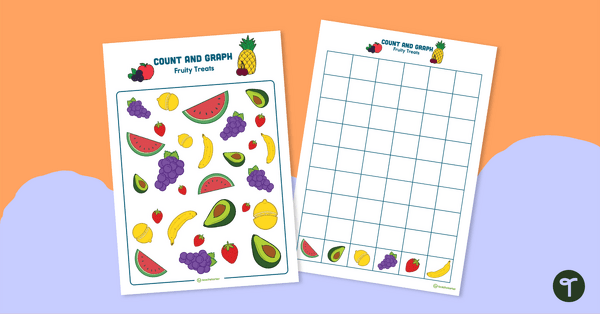
Count and Graph – Fruity Treats
A fruit-themed hands-on activity to introduce graphing skills.
- Free Plan
Python Patterns – Match-Up Activity
An activity for students to consolidate copying and creating patterns.
- Plus Plan
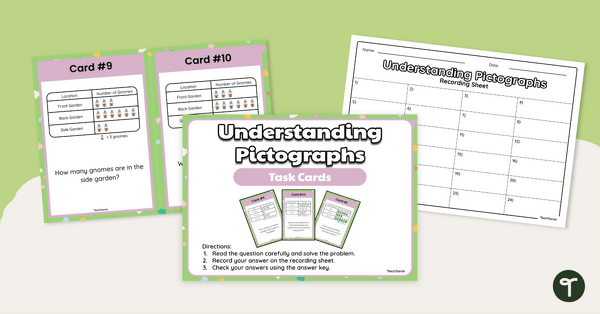
Understanding Pictographs - Task Cards
Use this set of task cards to practise reading and interpreting pictographs and bar graphs
- Plus Plan
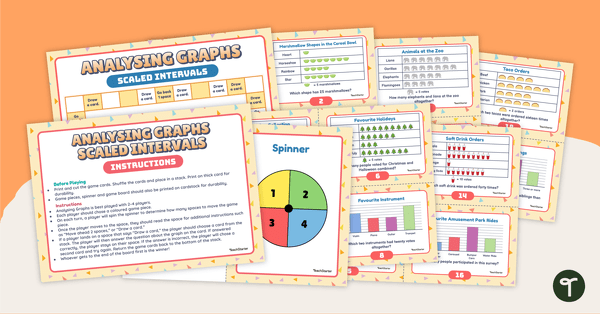
Analysing Graphs (Scaled Intervals) Board Game
Use this board game to sharpen data analysis skills when solving problems with information presented in a scaled picture or column graph.
- Plus Plan
Maths Warm Ups PowerPoint - Year 5
A PowerPoint providing a series of warm up activities for Year 5 students across the curriculum.
- Free Plan
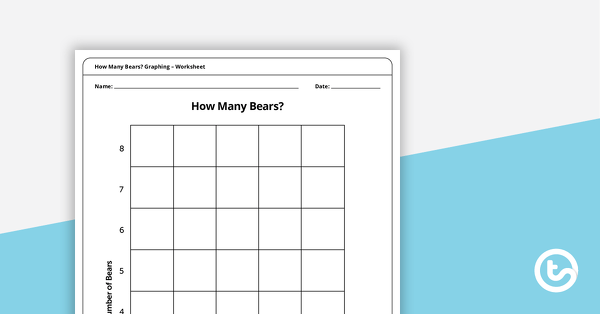
How Many Bears? Graphing – Worksheet
A hands-on picture graph worksheet for students to sort and count coloured bears.
- Plus Plan
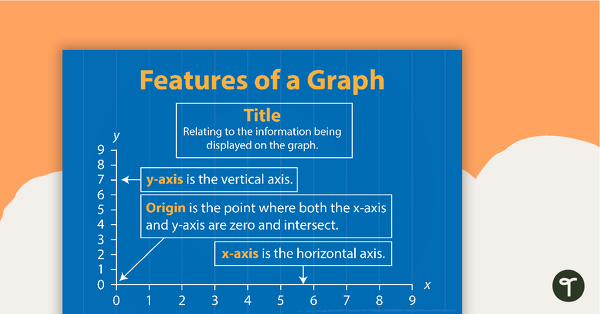
Features of a Graph
A poster showing the main features of a graph.
- Plus Plan
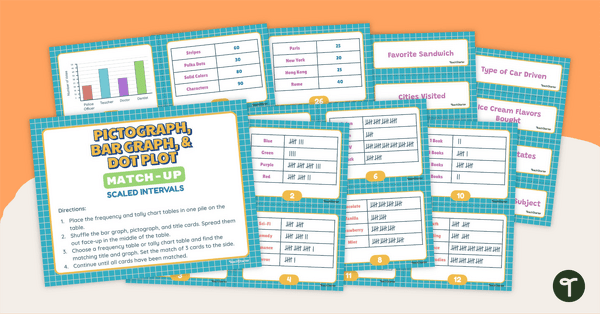
Pictograph, Bar Graph, and Dot Plot Match-Up (Scaled Intervals)
Use data analysis skills to match tally charts and frequency tables with their corresponding bar graph, pictograph, or dot plot.
- Plus Plan
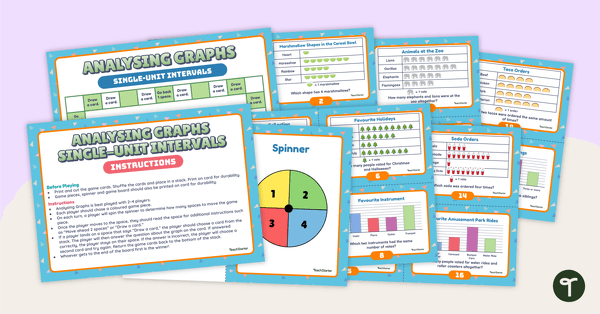
Analysing Graphs (Single-Unit Intervals) Board Game
Use this board game to sharpen data analysis skills when solving problems with information presented in a single-unit picture or column graph.
- Plus Plan
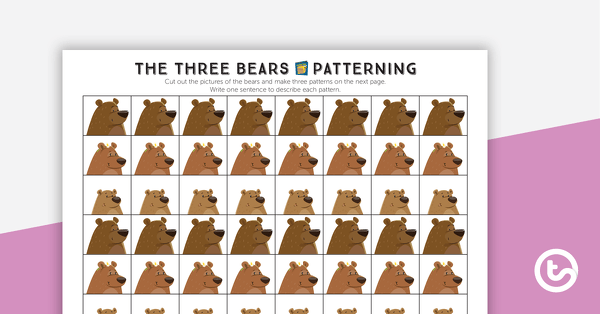
Three Bears Patterning Worksheet
A patterning worksheet using images of the bears from Goldilocks and the Three Bears.
- Plus Plan
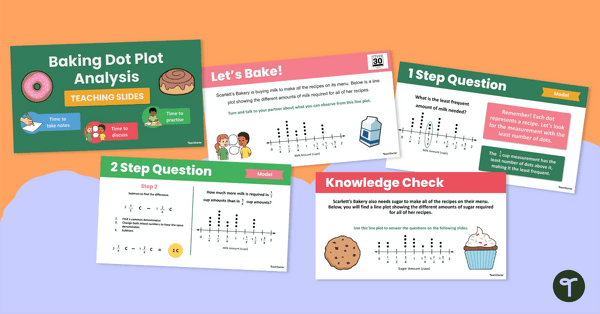
Baking Dot Plot Analysis Teaching Slides
Explore the sweet side of graphs and data with this bakery-themed dot plot resource, supporting your students' abilities to interpret dot plots!
- Plus Plan
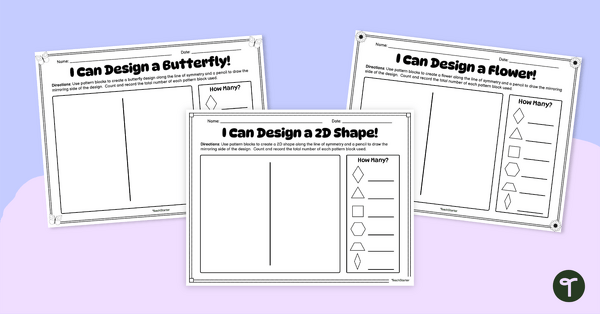
Symmetry Pattern Design Worksheet
Have your students create real-world symmetrical representations using this 3-page symmetry worksheet set and a tub of pattern blocks.
- Plus Plan
Interpreting Line Graphs Grade 5 Worksheet Set