Graphing Teaching Resources
- Plus Plan
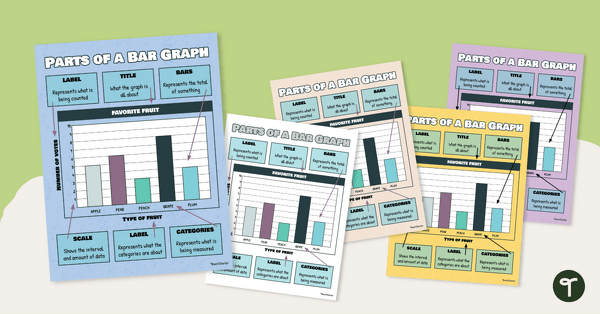
Bar Graph Anchor Chart
Hang this bar graph anchor chart in your classroom to teach your students about the different parts of this commonly used graph.
- Plus Plan
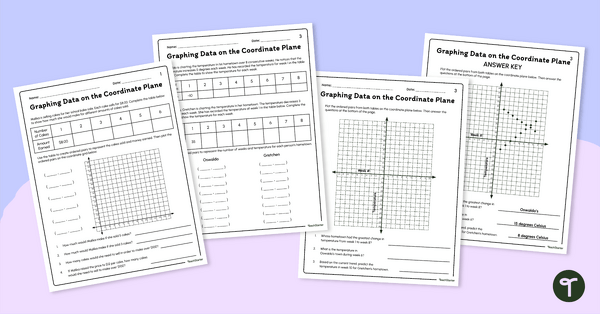
Graphing Data Worksheets (Coordinate Plane)
Introduce these graphing data worksheets to your students to give them practice graphing real-world situations on the coordinate plane.
- Plus Plan
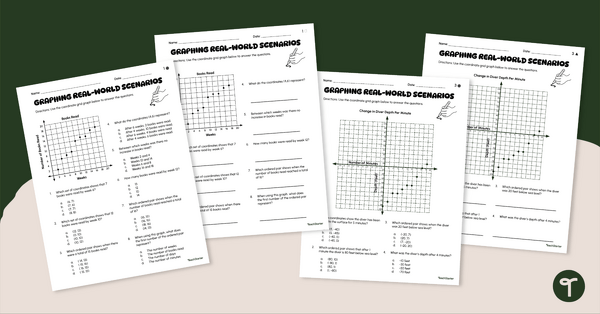
Real-World Math Problems on the Coordinate Plane Worksheet Set
Interpret real-world math problems on the coordinate plane with our differentiated worksheet set.
- Plus Plan
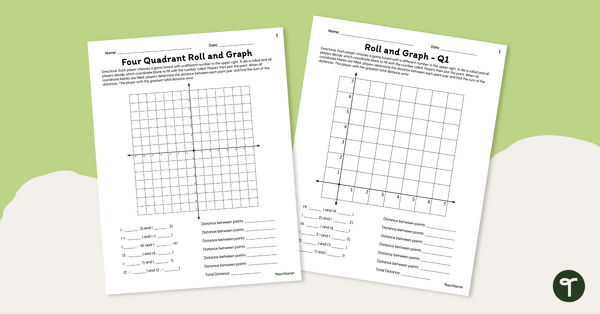
Coordinate Plane Games — "Roll and Graph"
Play our coordinate plane games in your classroom to enhance students’ ability to plot points and find the distance between them.
- Free Plan
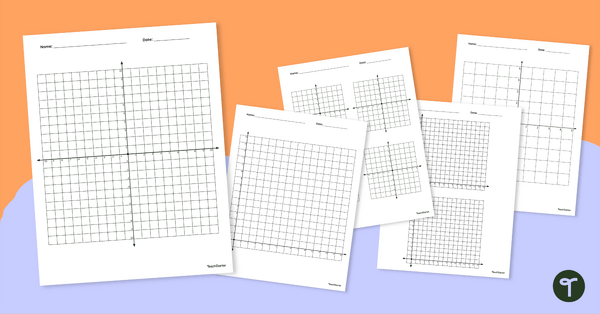
Coordinate Plane Printable Templates
Download these coordinate plane printable templates for use in your coordinate planes or graphing unit.
- Plus Plan
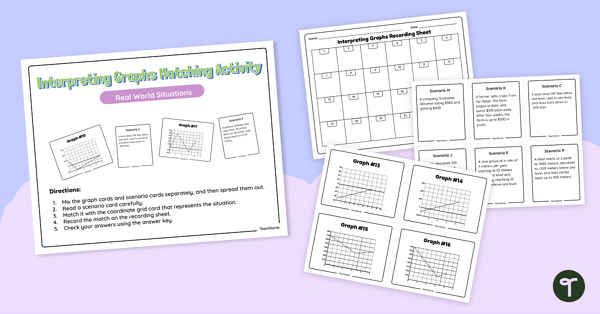
Interpreting Graphs on the Coordinate Plane Matching Activity
Incorporate this interpreting graphs matching activity into your unit on coordinate planes.
- Plus Plan
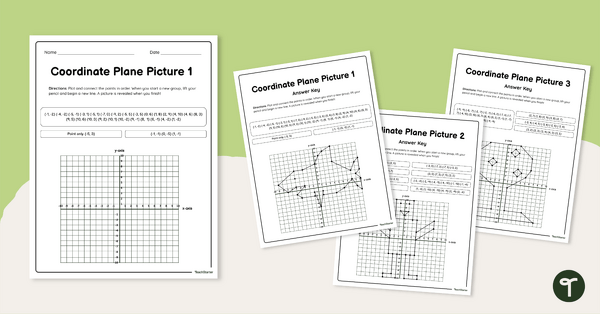
Coordinate Plane Pictures
Present these coordinate plane pictures to your students to enhance their skills in plotting points in all four quadrants.
- Plus Plan
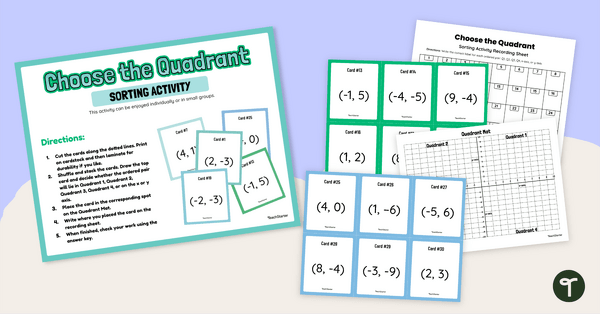
Coordinate Plane Activity — Four Quadrant Sort
Introduce this coordinate plane activity to students to enhance their skills in identifying ordered pairs in all four quadrants.
- Plus Plan
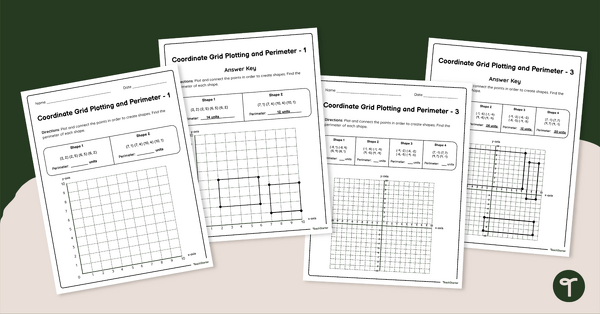
Coordinate Grid Worksheets — Plotting and Perimeter
Provide your students with these coordinate grid worksheets to help them master plotting and perimeter on the coordinate plane.
- Free Plan
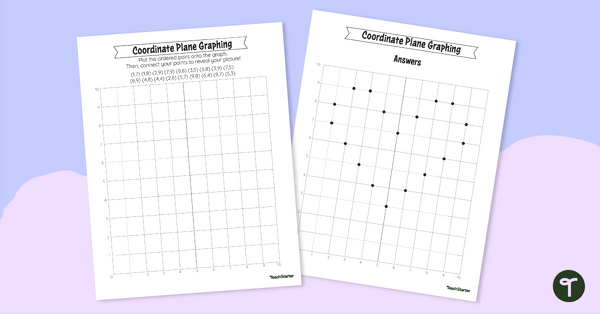
Plotting Points Mystery Picture — Valentine’s Day
Share this potting points mystery picture with your students on Valentine’s Day.
- Plus Plan
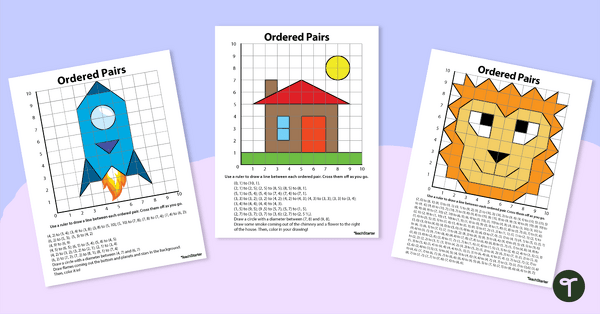
Ordered Pair Picture Pack
Practice plotting ordered pairs with this differentiated and engaging picture pack.
- Plus Plan
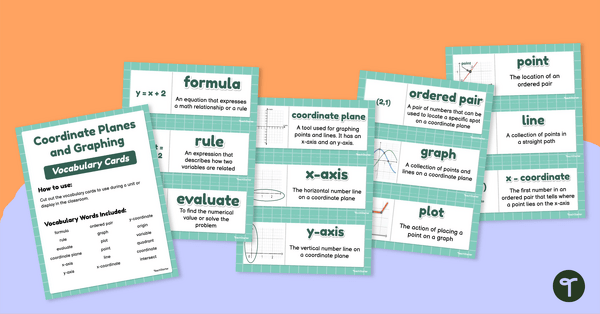
Coordinate Planes and Graphing Vocabulary Card Set
Introduce coordinate planes to your students with this set of 18 vocabulary cards.
- Plus Plan
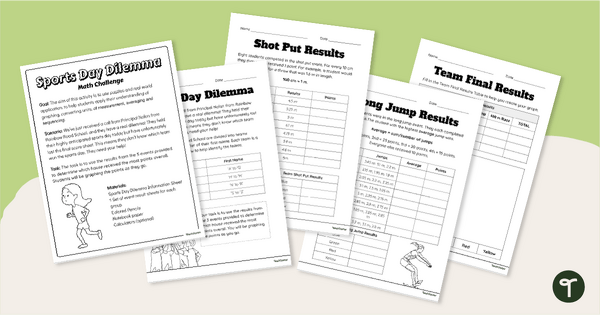
Sports Day Dilemma - Metric Conversions Math Task
Engage students with a real-world application of measurement conversions with Sports Day Dilemma, a metric conversion math task!
- Plus Plan
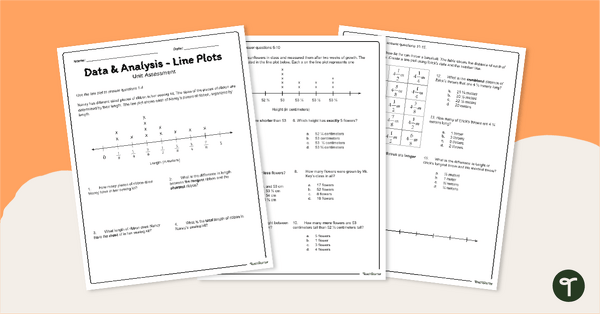
Dot Plots / Line Plots - 4th & 5th Grade Assessment
Assess student understanding of reading and creating line plots with a printable math test for 5th grade.
- Plus Plan
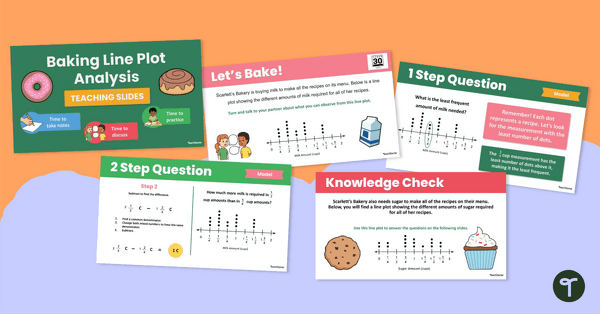
Baking Line Plot Analysis Teaching Slides
Explore the sweet side of graphs and data with this bakery-themed line plot resource, supporting your students' abilities to interpret line plots!
- Plus Plan
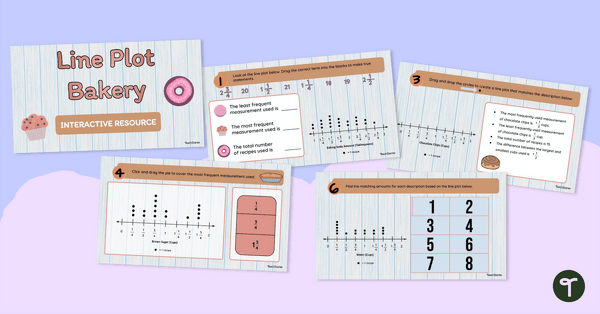
Dot Plot Bakery Interactive Activity
Strengthen dot plot skills with this bakery-themed interactive activity, designed to help students practice creating and analyzing dot graphs in a fun, structured way.
- Plus Plan
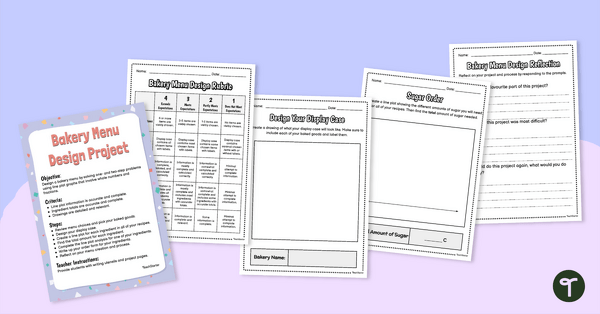
Line Plot Project: Bakery Menu Design
Make learning about math as sweet as your students' favorite treats with this project based learning line plots exercise!
- Plus Plan
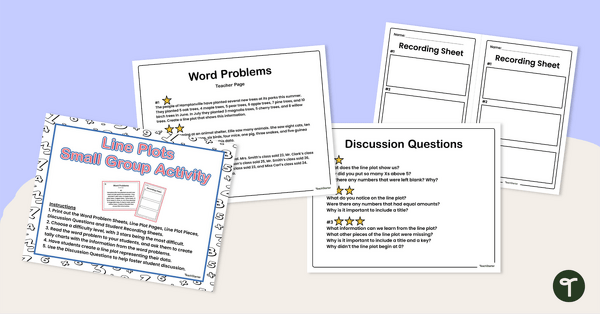
Creating Line Plots (with Fractions and Decimals) Small Group Activity
Incorporate this small group activity into your math centers to reinforce students skills in interpreting data and displaying it as line plots.
- Plus Plan
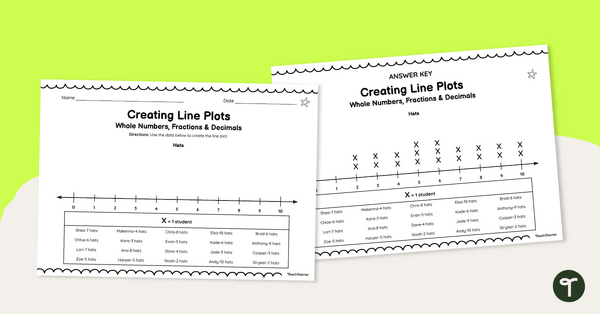
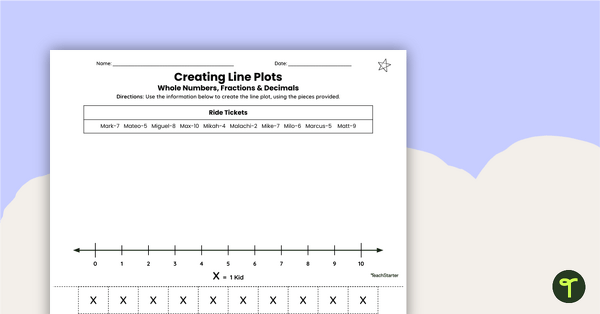
Creating Line Plots (With Whole Numbers, Fractions and Decimals) Worksheets
Help your students master data representation with this series of leveled worksheets for creating line plots.
- Plus Plan
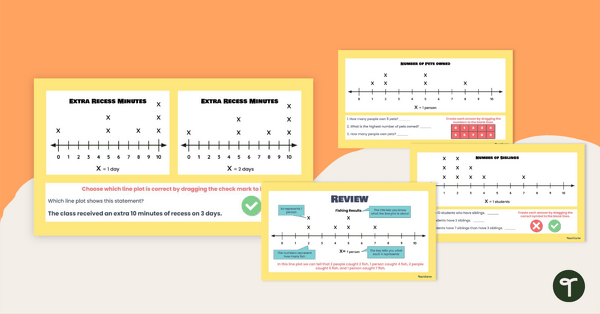
Analyzing Line Plots Interactive Activity
Dive into data with your class using this engaging Analyzing Line Plots Interactive Activity!
- Plus Plan
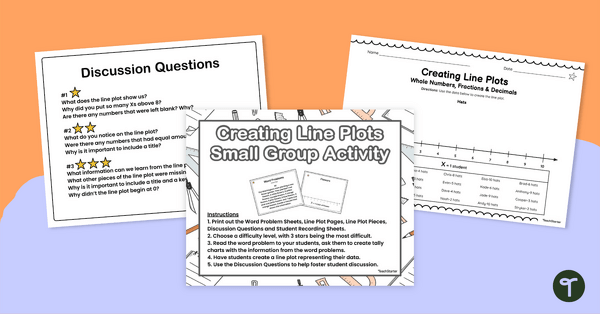
Creating Line Plots Small Group Activity
Enhance your students’ math skills through this small group activity where they’ll transfer word based data to create line plots.
- Plus Plan
Creating Line Plots (Fractions and Decimals) Cut and Paste Worksheets
Enable your students to create line plots to represent given data, using this hands-on cut and paste worksheet set.
- Plus Plan
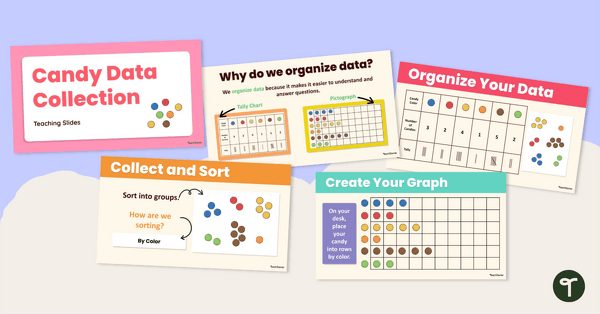
Candy Data Collection Instructional Slide Deck
Explore this candy-themed data collection teaching presentation to teach students the basics of acquiring and recording data.
- Plus Plan
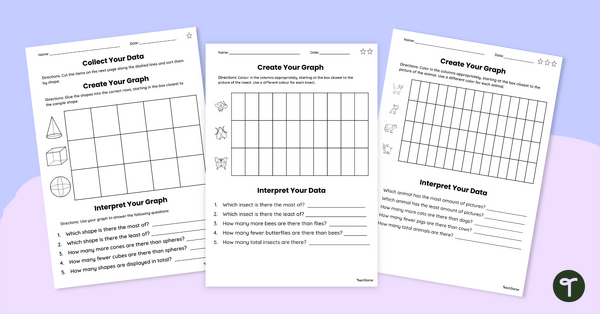
Data Collection Worksheet Set
Use this set of differentiated graphs worksheets to assess your students’ understanding of how data is collected, organized and presented.
- Plus Plan
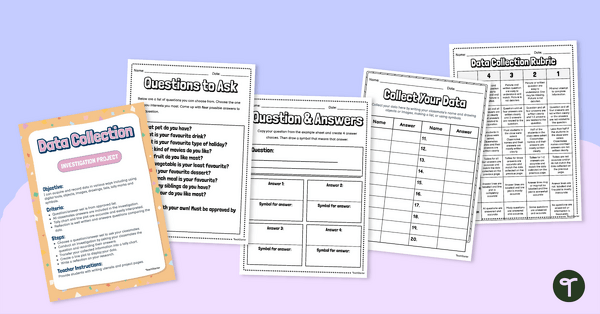
Data Collection Investigation Project
Assign this data collection project to enable students to master the skills of gathering, recording, and graphing data.
- Plus Plan
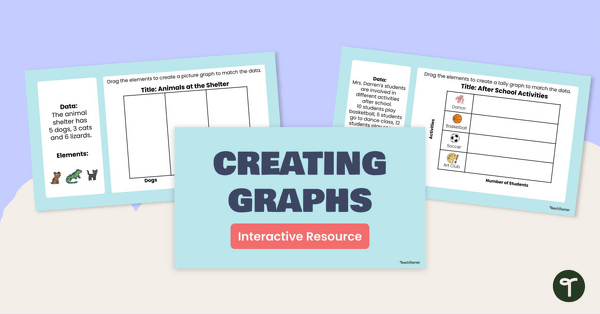
Creating Graphs Interactive Activity
Share this interactive activity with your students to help them practice using digital tools to create graphs from raw data.
- Plus Plan
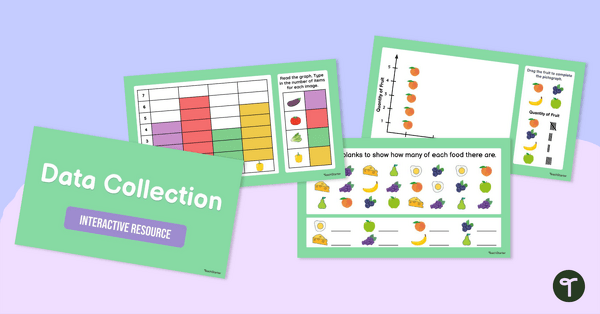
Data Collection Interactive Activity
Check your students’ understanding of interpreting data and using it to create graphs using this fun interactive game.
- Plus Plan
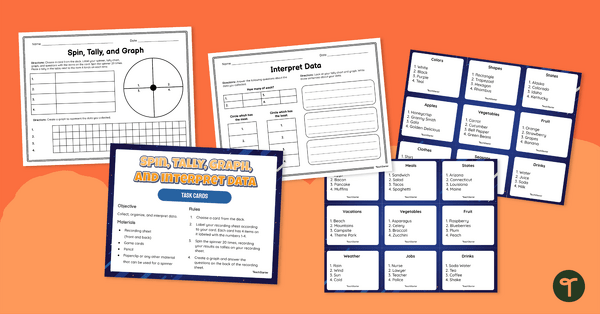
Spin, Tally, Graph and Interpret Data – Task Card Activity
Guide your students to collect data, make tally marks, create a bar graph and analyze data with this math activity designed for 1st and 2nd-grade students.
- Plus Plan
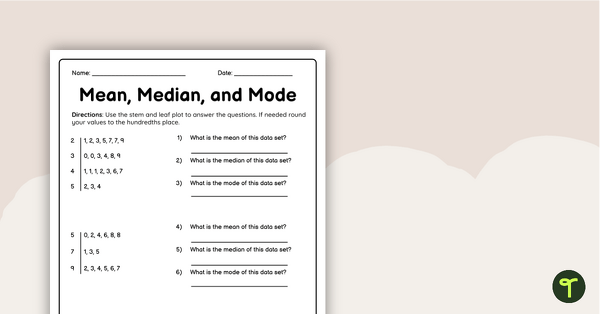
Mean Median Mode Worksheet
Use this double-sided worksheet to check students’ ability to find the mean, median and mode of given data sets.
- Plus Plan
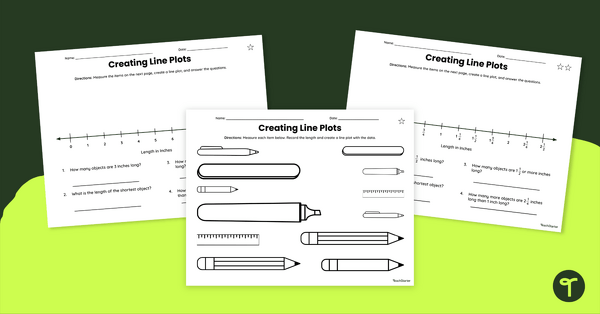
Creating Line Plots With Measurements – Differentiated Worksheets
Guide students to measure items to the nearest inch or ¼ inch, create a line plot and answer questions with this set of differentiated worksheets for 2nd and 3rd-grade students.
- Plus Plan
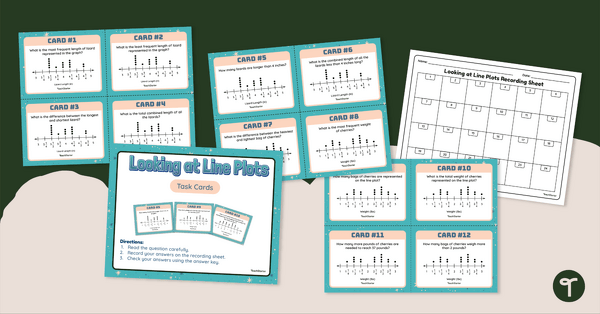
Looking at Line Plots With Fractions Task Cards
Challenge your students to analyze a line plot with fractions and answer questions with this this set of 24 task cards.
- Plus Plan
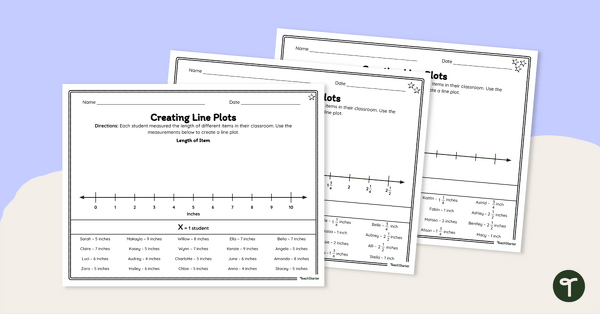
Differentiated Line Plot Worksheet
Guide your students to create line plots with whole-number or ¼ inch measurements with this differentiated line plot worksheet.