Graphs and Data Teaching Resources
- Free Plan
Dotted Journal Paper
Sheets of square dot paper templates.
- Free Plan
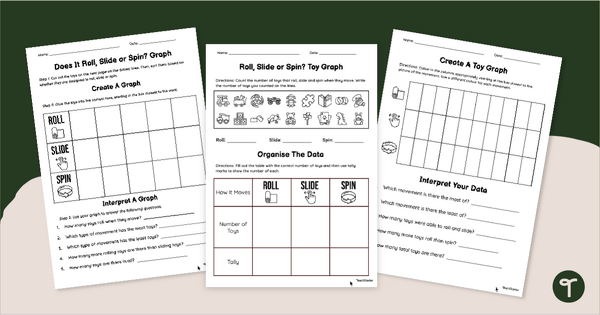
How Does It Move? Toy Graphing Worksheets
Explore motion and mathematics with engaging Toy Graphing Worksheets.
- Plus Plan
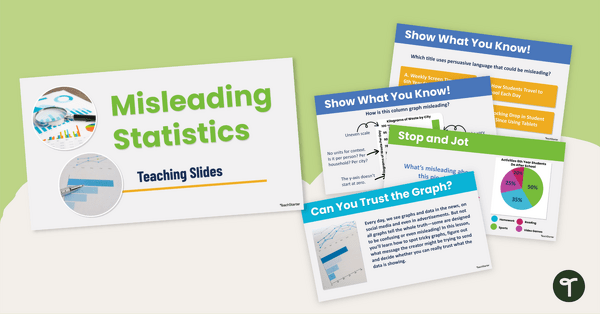
Misleading Statistics Teaching Slides
Use our misleading statistics teaching slides to increase statistical literacy and teach your students how to look at data displays with a critical eye.
- Plus Plan
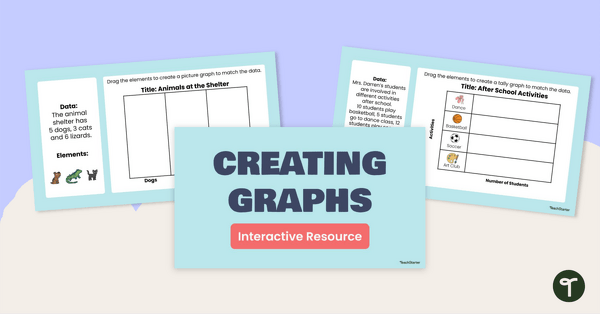
Creating Graphs Interactive Activity
Share this interactive activity with your students to help them practise using digital tools to create graphs from raw data.
- Plus Plan
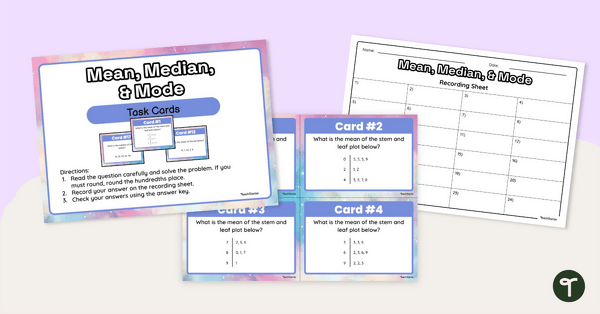
Mean Median and Mode Task Cards
Use this set of 24 data interpretation task cards to teach students to find the mean, median and mode of a limited data set.
- Free Plan

Creating a Graph Using Digital Technologies
A worksheet that supports students when collecting initial data and creating a digital graph.
- Plus Plan

Data Maths Investigation - Which Reward?
A mathematics investigation involving data collection and representation, embedded in a real-world context.
- Plus Plan
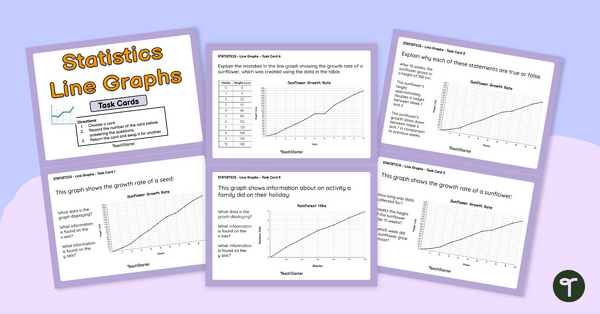
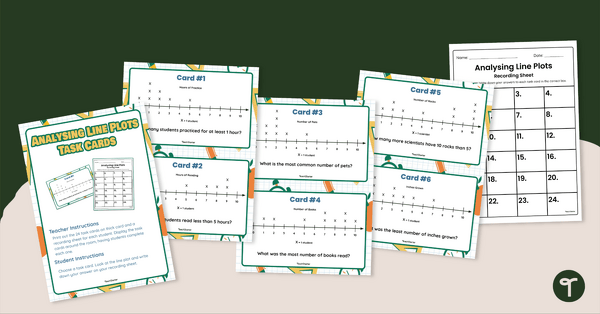
Interpreting Line Graphs Task Cards Grade 5
Use these task cards in your maths class to have students independently analyse and interpret line graphs.
- Plus Plan

Analysing Graphs – Single-Unit Bar Graphs and Pictographs – Task Cards
Use data analysis skills to analyse bar graphs and pictographs with this set of task cards.
- Plus Plan

Types of Graphs Posters and Worksheets
A collection of posters displaying the different types of graphs along with matching worksheets to assist students with laying out graphs on the page.
- Plus Plan
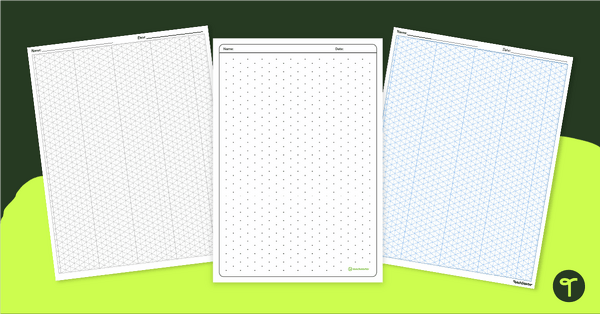
Isometric Drawing Paper - Dotty & Lined
Take your maths and design lessons to the next dimension with our collection of isometric drawing paper templates!
- Plus Plan
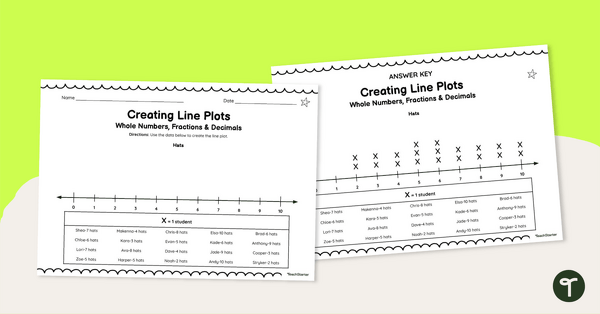
Creating Line Plots (With Whole Numbers, Fractions and Decimals) Worksheets
Help your students master data representation with this series of leveled worksheets for creating line plots.
- Plus Plan
Interpreting Line Graphs Grade 5 Worksheet Set
- Plus Plan
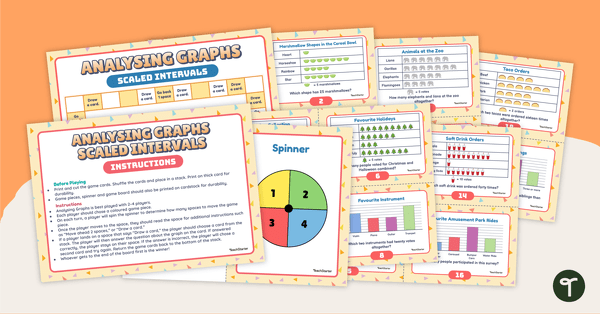
Analysing Graphs (Scaled Intervals) Board Game
Use this board game to sharpen data analysis skills when solving problems with information presented in a scaled picture or column graph.
- Free Plan

Picture Graph Templates
A set of blank picture graph templates for students to represent data.
- Plus Plan
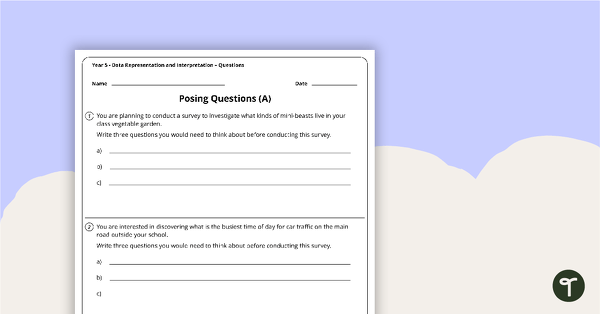
Data Representation and Interpretation Worksheets - Year 5
8 data representation and interpretation worksheets linked to the Australian Curriculum.
- Plus Plan
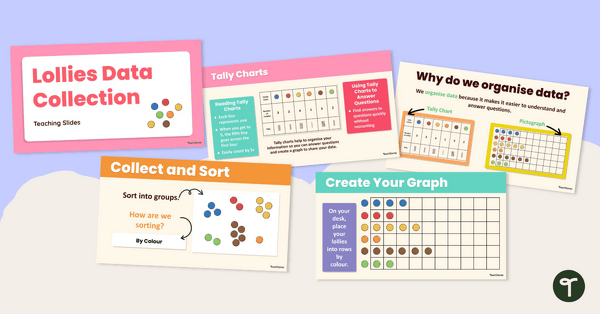
Lollies Data Collection Instructional Slide Deck
Explore this sweet-themed data collection teaching presentation to teach students the basics of recording data and creating a pictograph.
- Plus Plan
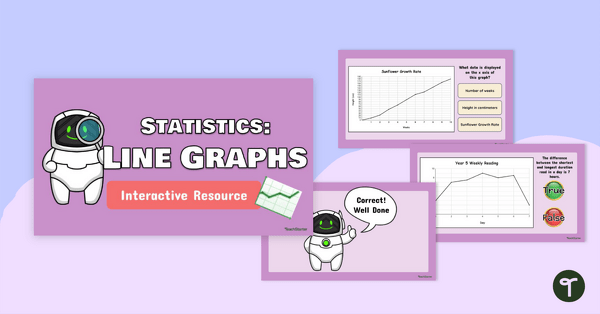
Interpreting Line Graphs Interactive Resource
Use this digital activity to teach students about interpreting real-life data represented as a line graph showing how measurements change over a period of time.
- Plus Plan
Analysing Dot Plots Task Cards
Strengthen data analysis skills by interpreting dot plots with this set of 24 task cards.
- Plus Plan
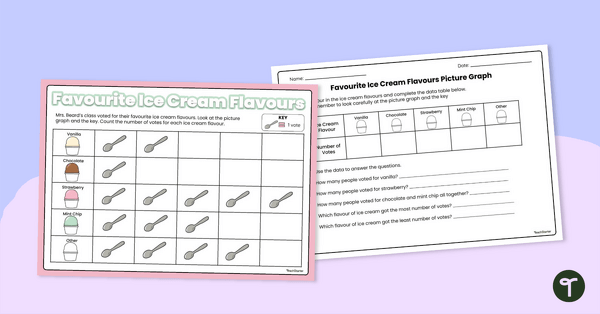
Picture Graphs Worksheet
Use this double-sided worksheet to help your students practise reading and evaluating a simple picture graph.
- Plus Plan
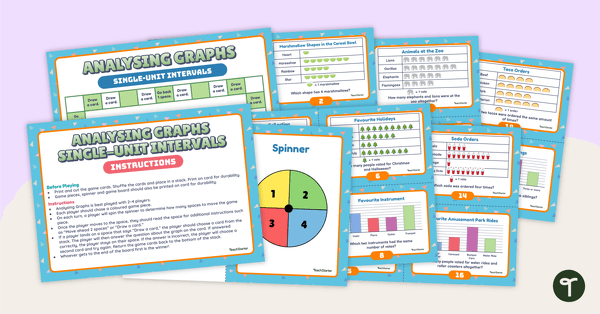
Analysing Graphs (Single-Unit Intervals) Board Game
Sharpen data analysis skills when solving problems with information presented in a single-unit picture or column graph with this board game.
- Plus Plan
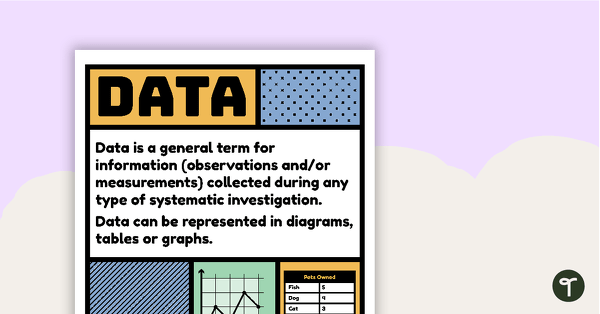
Data Vocabulary Poster
A poster that explains the concept of data and lists associated vocabulary.
- Plus Plan
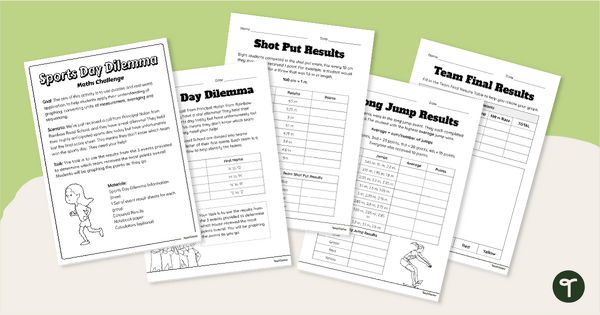
Sports Day Dilemma - Metric Conversions Maths Task
Engage students with a real-world application of measurement conversions with Sports Day Dilemma, a metric conversion maths task!
- Plus Plan
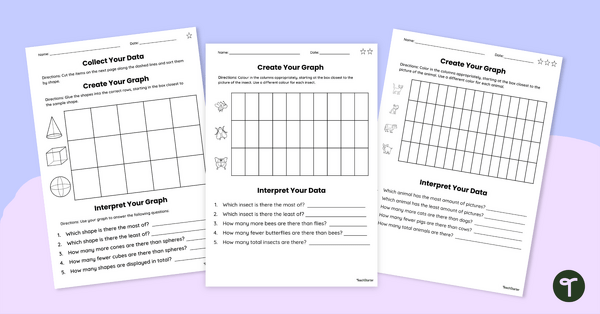
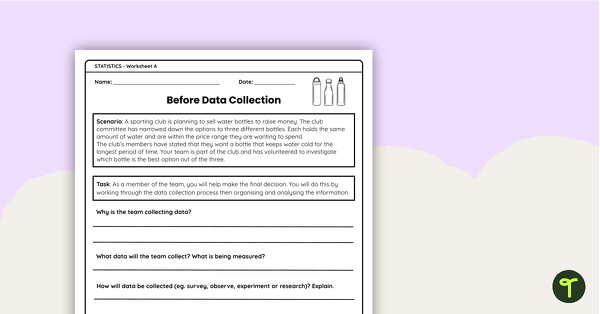
Data Collection Worksheet Set
Use this set of differentiated graphs worksheets to assess your students’ understanding of how data is collected, organised and presented.
- Plus Plan
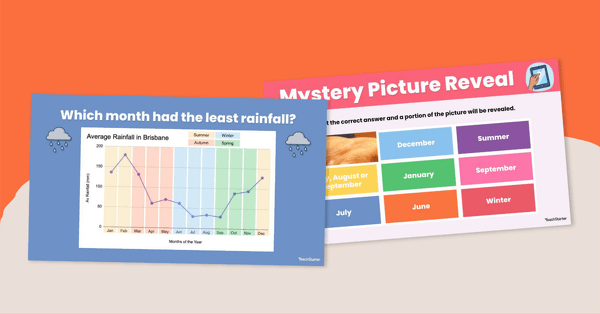
Interpreting Line Graphs Interactive Activity Grade 5
Solve the space man's line graph questions and complete the challenge with this interpreting line graphs interactive game!
- Plus Plan
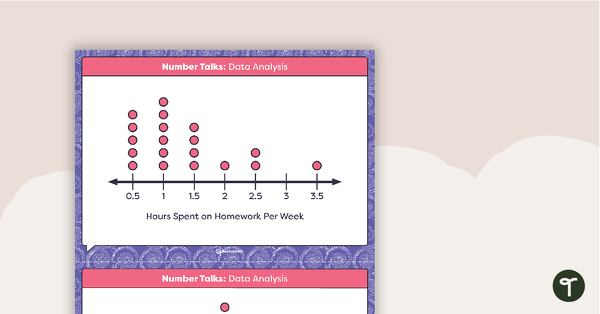
Number Talks - Data Analysis Task Cards
Build data analysis skills with this set of 26 task cards.
- Plus Plan
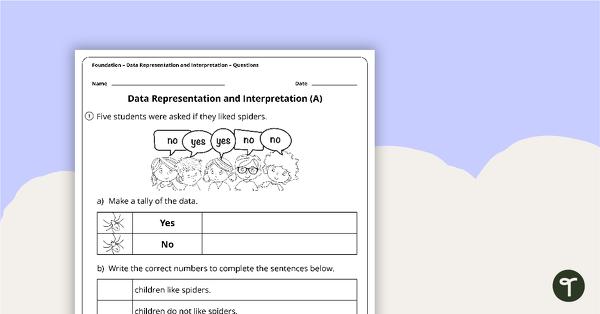
Data Representation and Interpretation Worksheets - Foundation
2 data representation and location worksheets linked to the Australian Curriculum.
- Plus Plan
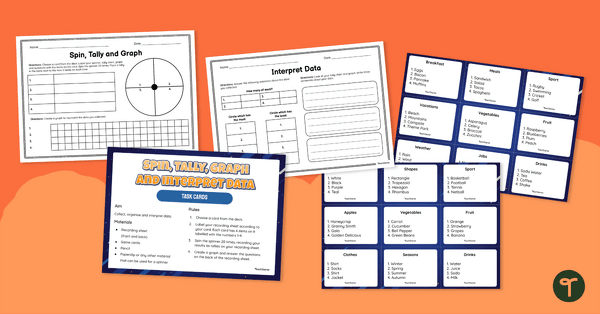
Spin, Tally, Graph and Interpret Data Task Card Activity
Guide your students to collect data, make tally marks, create a column graph and analyse data with this maths activity.
- Plus Plan
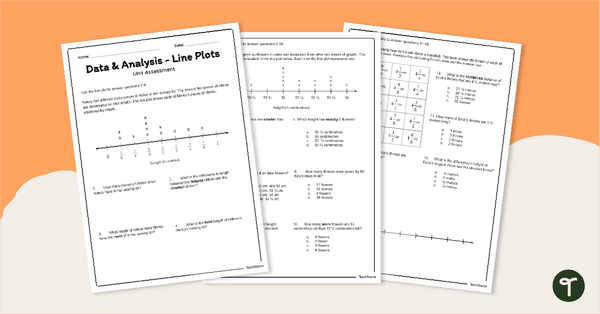
Line Plots / Dot Plots - Year 5 Assessment
Assess student understanding of reading and creating dot plots/line plots with a printable assessment for Year 5.
- Plus Plan
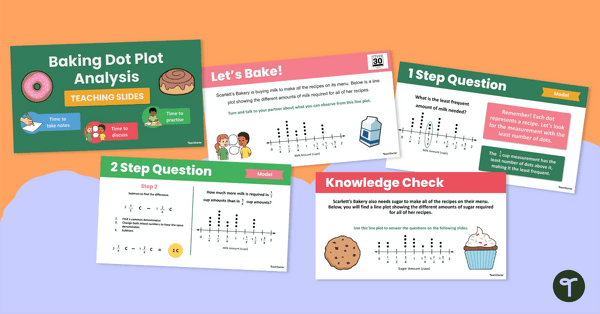
Baking Dot Plot Analysis Teaching Slides
Explore the sweet side of graphs and data with this bakery-themed dot plot resource, supporting your students' abilities to interpret dot plots!
- Plus Plan
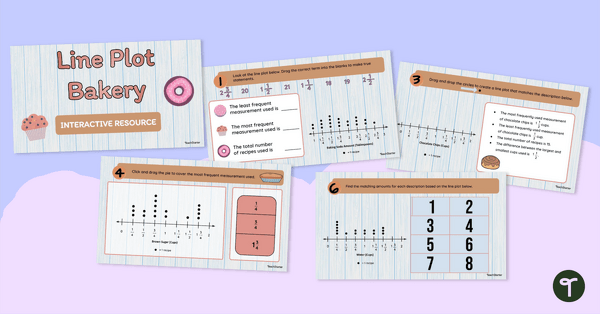
Dot Plot Bakery Interactive Activity
Strengthen dot plot skills with this bakery-themed interactive activity, designed to help students practise creating and analysing dot graphs in a fun, structured way.
- Free Plan
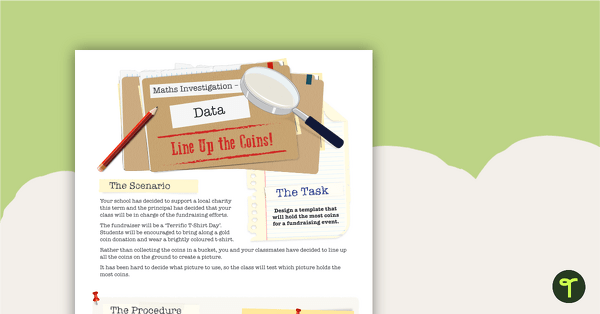
Data Maths Investigation – Line Up the Coins
A mathematics investigation about data, embedded in a real-world context.