Types of Graphs Teaching Resources
Teach your students the different types of graphs with printable graphing activities, worksheets, games and more data activities created by teachers for teachers like you!
Designed to align with the Australian maths curriculum, the printables and digital activities in this collection can help you not just introduce each type of graph but also give your students practise using each one to represent and analyse data on a variety of graph types.
Whether it's your first year covering the various types of graphs in your math classes, or you're just looking for some handy tips and tricks, the Teach Starter teacher team has you covered. Read on for a primer that covers some of the main graph types plus a handy way to explain what a graph is to your students.
What Is a Graph? A Kid-Friendly Definition
Before you can start talking about the various graph types, it helps to explain what a graph is. That's where our definition could come in handy!
A graph is a visual way to show data. Graphs help make information easier to understand and analyze.
What Are the Different Types of Graphs?
There is a long list of different types of graphs that mathematicians use to represent numbers and other forms of data. So which graph types do your students need to know about right now?
Let's take a look at the more common graphing types we use in primary school maths classes:
1. Bar Graphs or Column Graphs
A bar graph or a column graph is a type of graph that uses rectangular shapes called bars or columns to represent quantities or values of data. Bars on a bar graph will be different heights or different lengths to represent the quantity or value.
This makes it easy to compare the values.
2. Line Graphs
A line graph uses points that are connected by lines to show the relationship between two sets of data.
Line graphs are helpful when we want to see changes in data sets over a period of time.

3. Pictographs
The picto in pictographs refers to pictures, which are used in this graph type to represent data.
4. Pie Charts
Did you know that a graph is a kind of chart? Although pie charts may not be called 'pie graphs,' these circles divided by lines to resemble slices of pie are most definitely a type of graph.
Pie charts can be used to represent parts of a whole or categories of a whole, and they help us understand the proportion or percentage of each category.
- Plus Plan
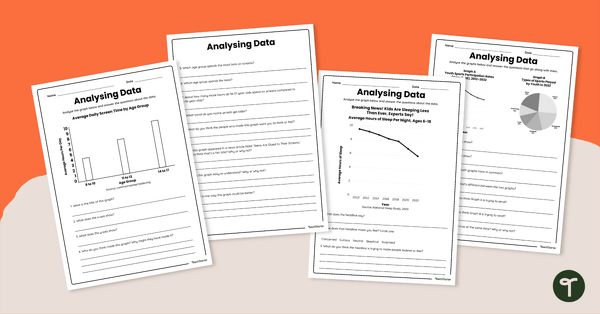
Analysing Data Worksheet Set
Share this analysing data worksheet set with your students to give them varied practice interpreting multiple data representations.
- Plus Plan
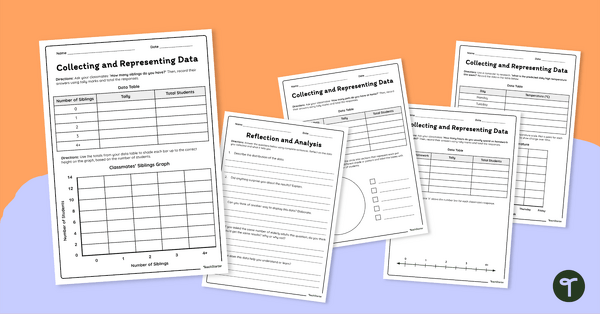
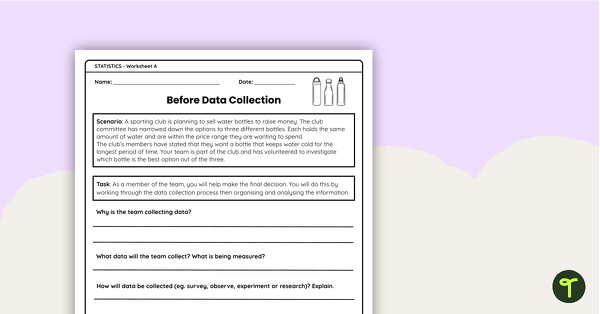
Collecting and Representing Data Worksheet Set
Download our collecting and representing data worksheet set to get your students collecting, organising and displaying data.
- Plus Plan
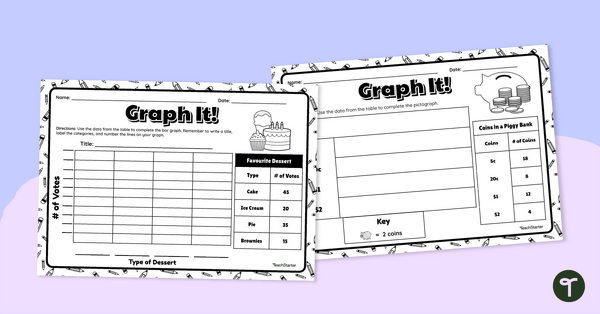
Graph It! Worksheet (Many-to-One Graphs)
Draw a scaled picture graph and bar graph to represent data with this worksheet.
- Plus Plan
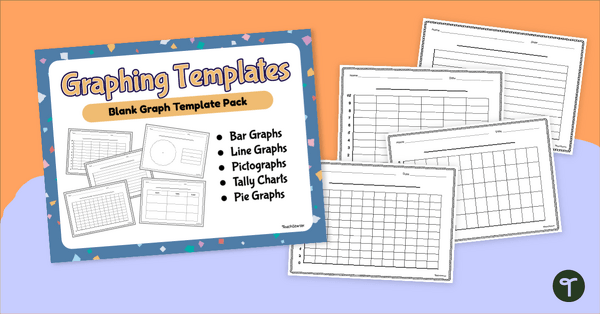
Blank Graph Template Pack
Construct your own graphs with a printable set of Blank Graph Templates.
- Plus Plan
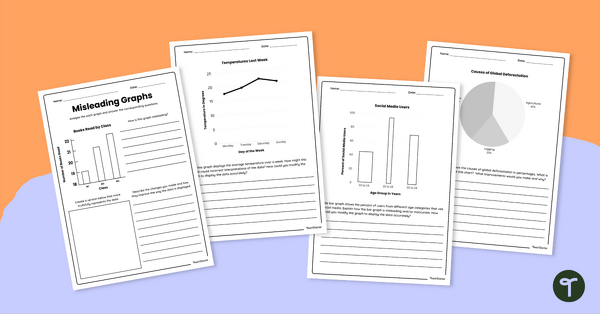
Misleading Graphs Worksheet Set
Download our misleading graphs worksheet set to increase your students’ abilities in statistical literacy and data analysis.
- Plus Plan
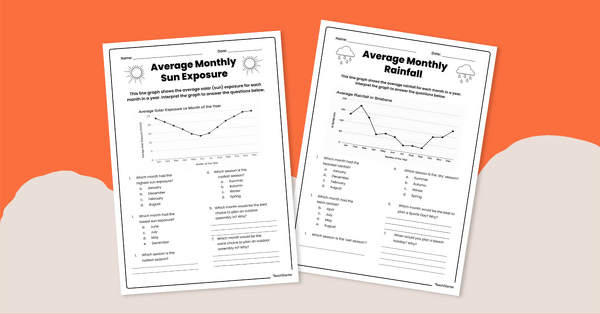
Interpreting Line Graphs Worksheet Pack
Use this set of 4 Grade 5 worksheets to help students practise interpreting real-life data represented as a line graph.
- Plus Plan
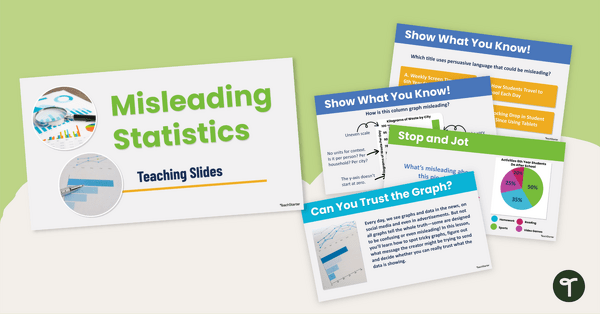
Misleading Statistics Teaching Slides
Use our misleading statistics teaching slides to increase statistical literacy and teach your students how to look at data displays with a critical eye.
- Plus Plan
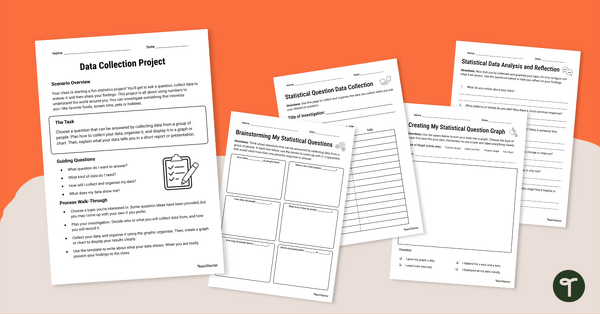
Data Collection Project
Complete this data collection project with your students to give them practise developing a statistical question, collecting data and displaying the results.
- Plus Plan
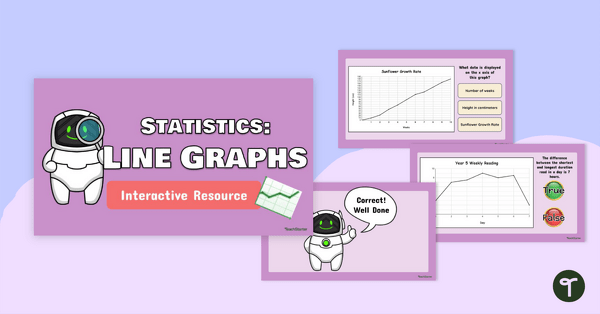
Interpreting Line Graphs Interactive Resource
Use this digital activity to teach students about interpreting real-life data represented as a line graph showing how measurements change over a period of time.
- Plus Plan
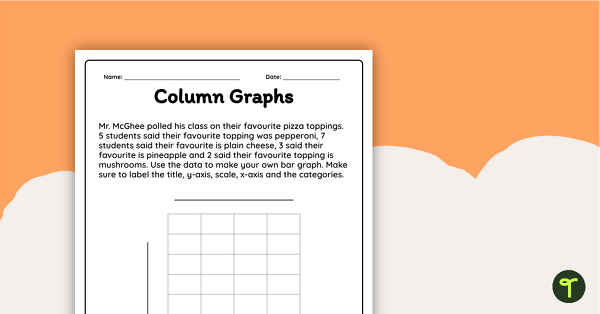
Creating a Bar Graph Worksheet
Interpret data and create a column graph display with this worksheet.
- Plus Plan
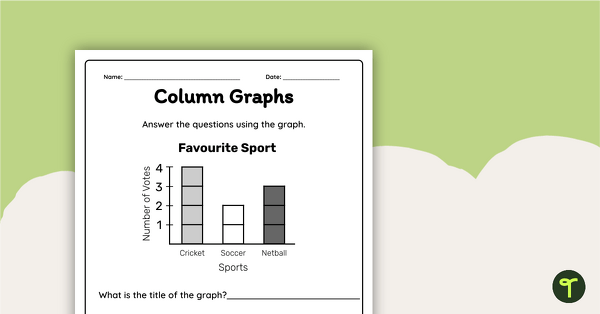
Interpreting a Column Graph Worksheet
Interpret information from a column graph and answer questions with this worksheet.
- Plus Plan

Types of Graphs Posters
Show students the varying data displays they will encounter in their primary maths lessons with these colourful and easy-to-digest visual posters.
- Plus Plan
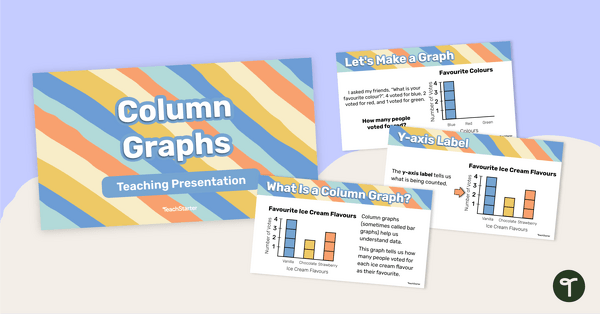
Column Graphs – Teaching Presentation
Learn all the features and how to construct a column graph with this 25-page teaching presentation.
- Plus Plan
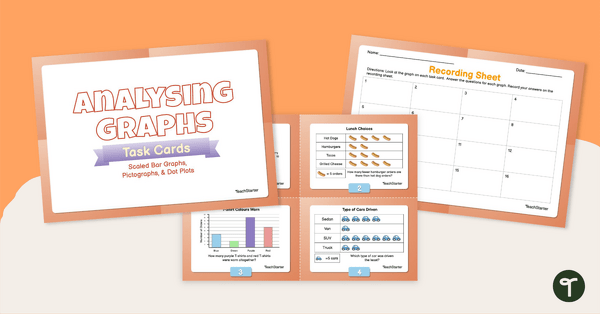
Analysing Graphs — Scaled Bar Graphs, Pictographs, & Dot Plots —Task Cards
Use data analysis skills to analyse scaled bar graphs, pictographs, and dot plots with this set of task cards.
- Plus Plan
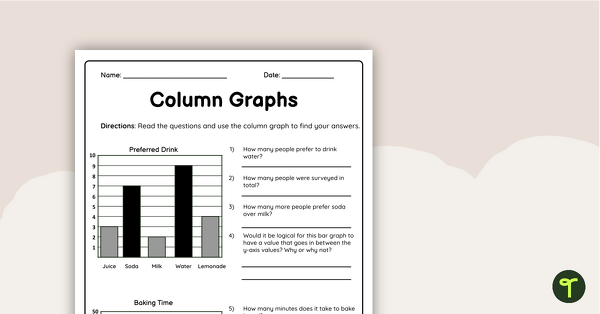
Column Graphs Grade 5 Worksheet
Use this double-sided column graphs worksheet to check your students’ understanding of interpreting and drawing column graphs.
- Free Plan
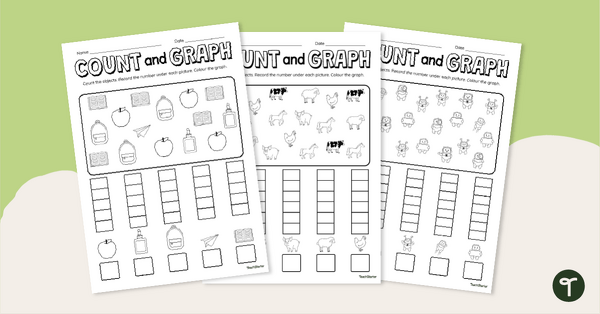
Count and Graph Worksheet Pack
Explore counting and graphing skills with this set of three worksheets.
- Plus Plan
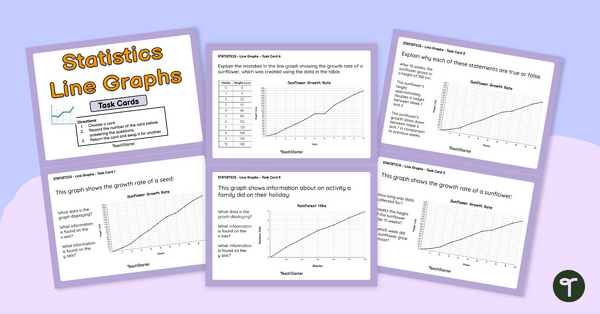
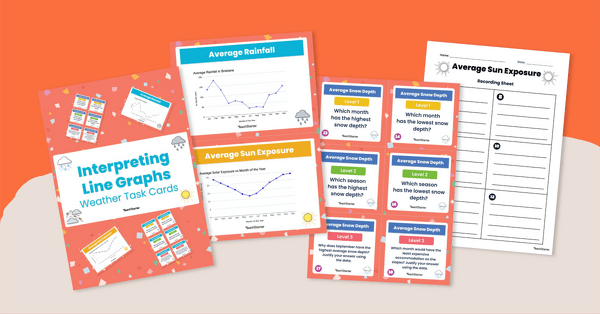
Interpreting Line Graphs Task Cards Grade 5
Use these task cards in your maths class to have students independently analyse and interpret line graphs.
- Plus Plan
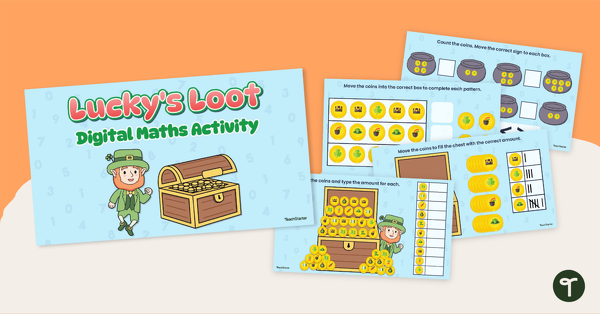
St Patrick's Day Digital Maths Activity
Celebrate St Patrick’s Day with a spot of Maths fun!
- Free Plan

Creating a Graph Using Digital Technologies
A worksheet that supports students when collecting initial data and creating a digital graph.
- Plus Plan
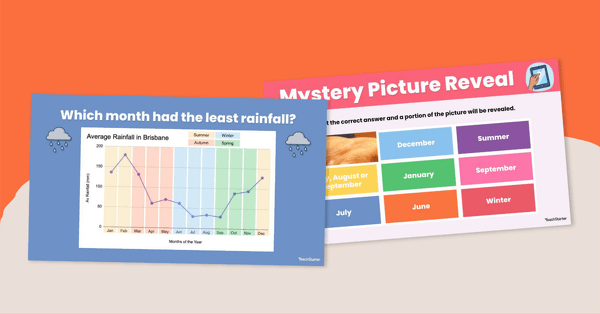
Interpreting Line Graphs Interactive Activity Grade 5
Solve the space man's line graph questions and complete the challenge with this interpreting line graphs interactive game!
- Plus Plan
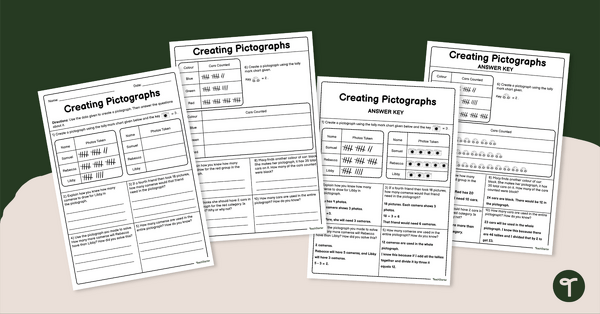
Creating Pictographs Worksheet
Use this engaging worksheet to practice creating and reading pictographs.
- Plus Plan
Interpreting Line Graphs Task Cards
Engage your Grade 5 learners with this task card set focused on interpreting line graphs.
- Plus Plan
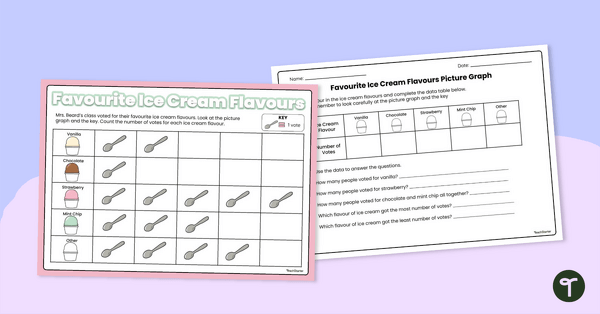
Picture Graphs Worksheet
Use this double-sided worksheet to help your students practise reading and evaluating a simple picture graph.
- Plus Plan
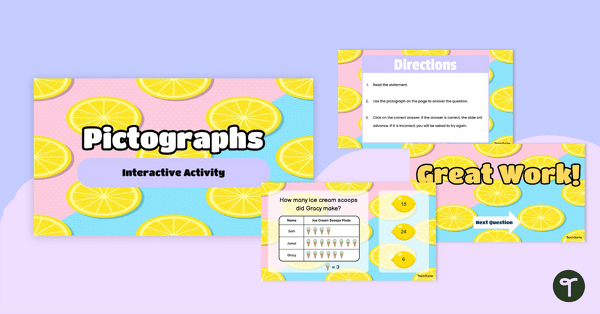
Pictographs - Interactive Activity
Use this fun and engaging interactive activity to aid students. in practicing their pictograph interpretation skills.
- Plus Plan
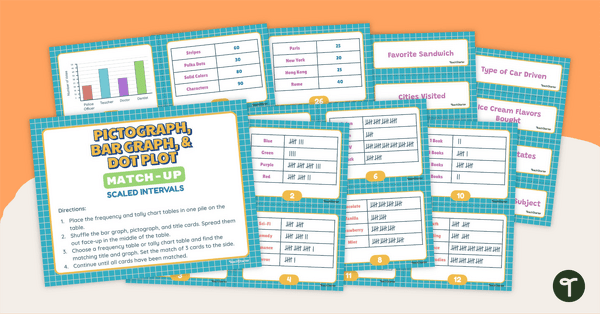
Pictograph, Bar Graph and Dot Plot Match-Up (Scaled Intervals)
Use data analysis skills to match tally charts and frequency tables with their corresponding bar graph, pictograph, or dot plot.
- Plus Plan
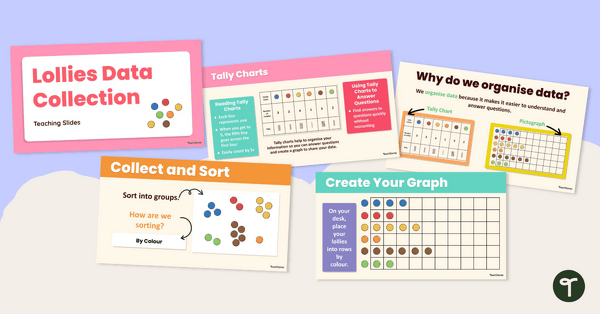
Lollies Data Collection Instructional Slide Deck
Explore this sweet-themed data collection teaching presentation to teach students the basics of recording data and creating a pictograph.
- Plus Plan
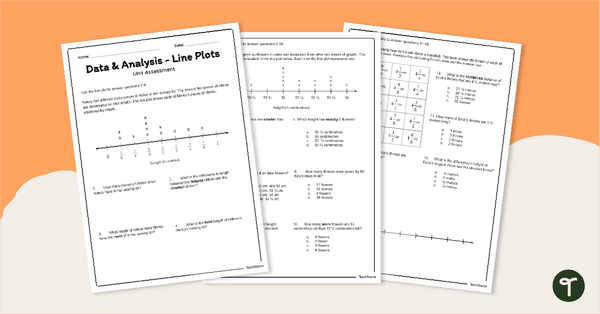
Line Plots / Dot Plots - Year 5 Assessment
Assess student understanding of reading and creating dot plots/line plots with a printable assessment for Year 5.
- Plus Plan
Interpreting Line Graphs Grade 5 Worksheet Set
- Plus Plan
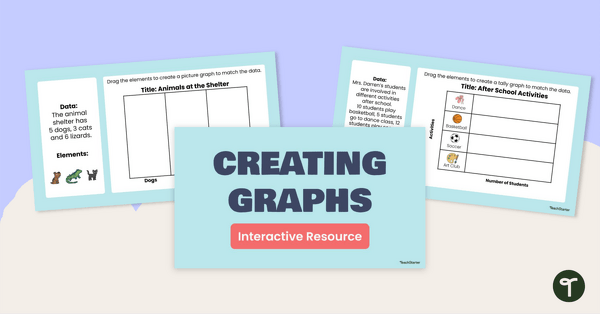
Creating Graphs Interactive Activity
Share this interactive activity with your students to help them practise using digital tools to create graphs from raw data.
- Plus Plan
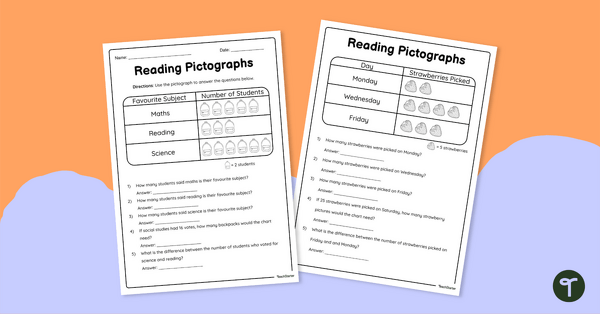
Reading Pictographs - Worksheets
Use this double-sided worksheet to enable students to practise reading and interpreting pictographs.
- Plus Plan

Analysing Graphs – Single-Unit Bar Graphs and Pictographs – Task Cards
Use data analysis skills to analyse bar graphs and pictographs with this set of task cards.
- Plus Plan
Understanding Pictographs - Task Cards
Use this set of task cards to practise reading and interpreting pictographs and bar graphs