Data representation and interpretation
Based on the Australian Curriculum, Data representation and interpretation in Mathematics Year 4 includes:
- ACMSP095 Select and trial methods for data collection, including survey questions and recording sheets
- ACMSP096 Construct suitable data displays, with and without the use of digital technologies, from given or collected data. Include tables, column graphs and picture graphs where one picture can represent many ...
- ACMSP097 Evaluate the effectiveness of different displays in illustrating data features including variability
- Plus Plan
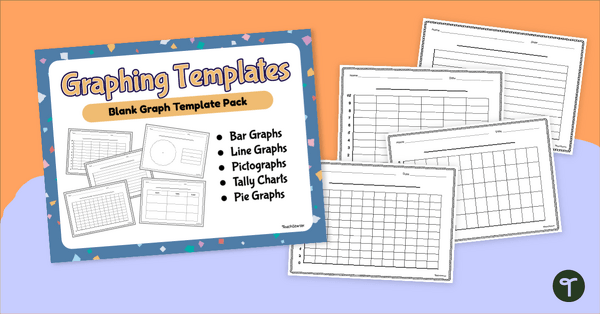
Blank Graph Template Pack
Construct your own graphs with a printable set of Blank Graph Templates.
- Plus Plan
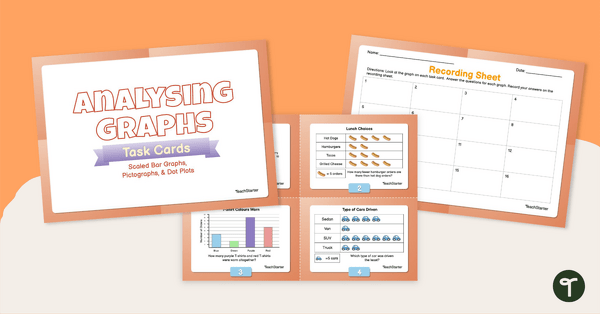
Analysing Graphs — Scaled Bar Graphs, Pictographs, & Dot Plots —Task Cards
Use data analysis skills to analyse scaled bar graphs, pictographs and dot plots with this set of task cards.
- Plus Plan
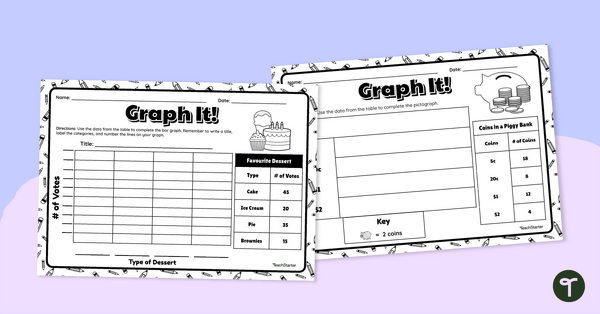
Graph It! Worksheet (Many-to-One Graphs)
Draw a scaled picture graph and bar graph to represent data with this worksheet.
- Free Plan
Picture Graph Templates
A set of blank picture graph templates for students to represent data.
- Plus Plan
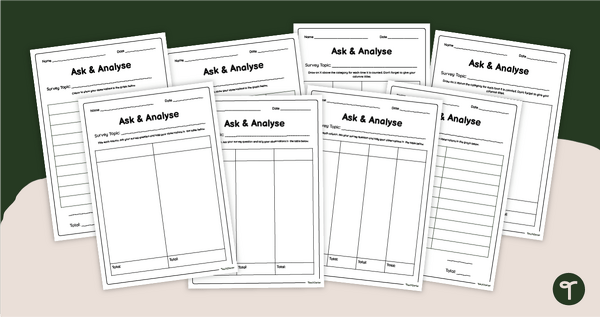
Editable Blank Survey Template For Students
Organise student survey data with a set of printable blank survey templates.
- Plus Plan
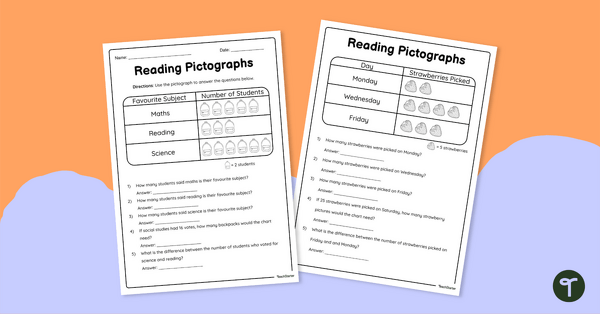
Reading Pictographs - Worksheets
Use this double-sided worksheet to enable students to practise reading and interpreting pictographs.
- Plus Plan
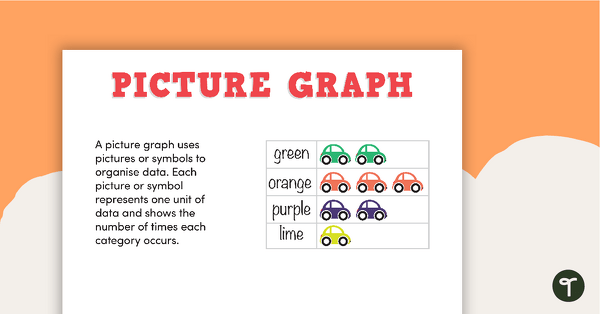
Types of Graphs Posters and Worksheets
A collection of posters displaying the different types of graphs along with matching worksheets to assist students with laying out graphs on the page.
- Plus Plan
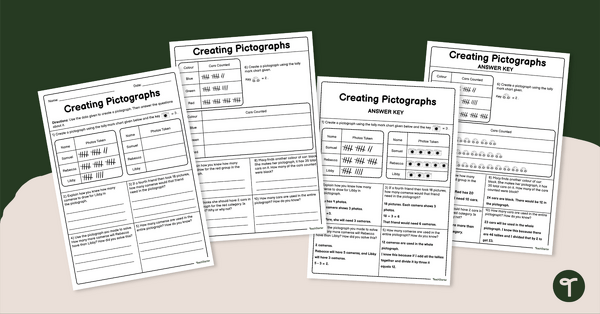
Creating Pictographs Worksheet
Use this engaging worksheet to practice creating and reading pictographs.
- Plus Plan

Data Maths Investigation - Which Reward?
A mathematics investigation involving data collection and representation, embedded in a real-world context.
- Plus Plan
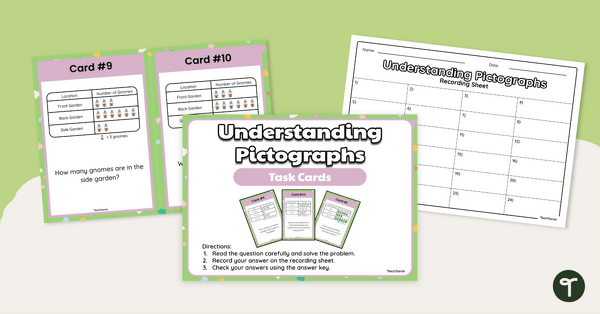
Understanding Pictographs - Task Cards
Use this set of task cards to practise reading and interpreting pictographs and bar graphs