Graphing Teaching Resources
- Plus Plan
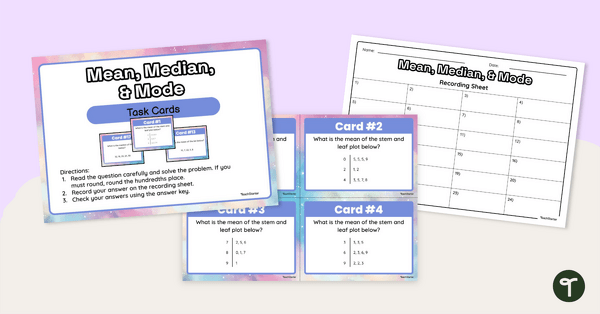
Mean Median and Mode Task Cards
Use this set of 24 data interpretation task cards to teach students to find the mean, median and mode of a limited data set.
- Plus Plan
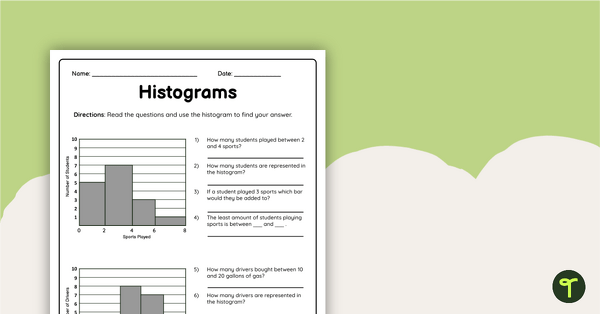
Histograms Worksheet
Encourage your students to practice reading and creating histogram graphs using this double-sided worksheet with answer key included.
- Free Plan
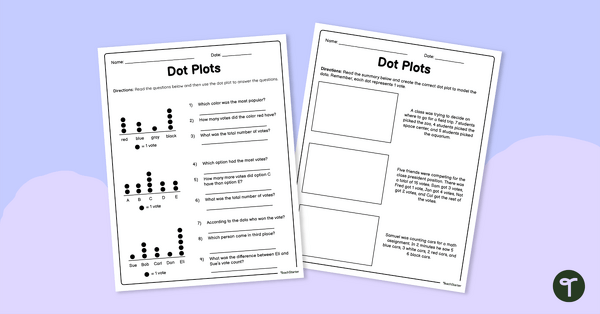
Dot Plot Worksheet for 2nd Grade
Practice analyzing and creating single-unit dot plots with this free math worksheet for 2nd-grade students.
- Plus Plan
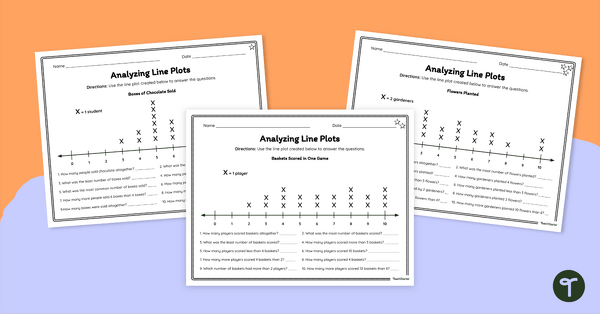
Analyzing Line Plots – Differentiated Worksheets
Empower your students to become proficient data interpreters with this set of differentiated line plot worksheets.
- Plus Plan
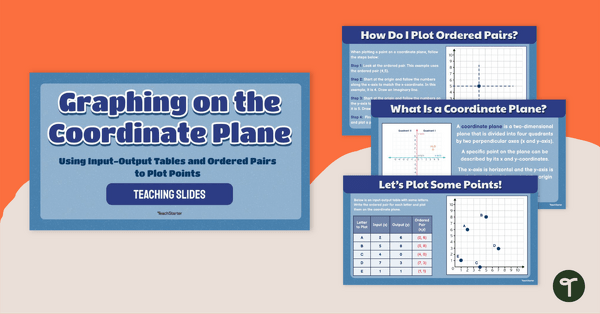
Graphing on the Coordinate Plane Teaching Slides
Teach your students how to plot points on a graph using ordered pairs from input-output tables with this set of teaching slides.
- Plus Plan
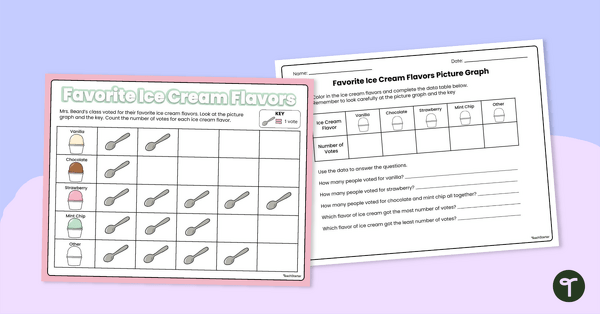
Picture Graphs - Worksheet
Use this double-sided worksheet to help your students practice reading and evaluating a simple picture graph.
- Plus Plan
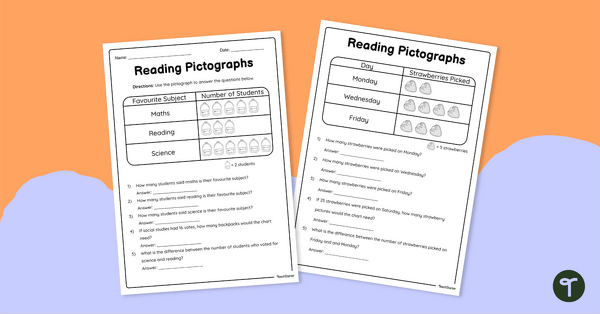
Reading Pictographs - Worksheets
Use this double-sided worksheet to enable students to practice reading and interpreting pictographs.
- Plus Plan
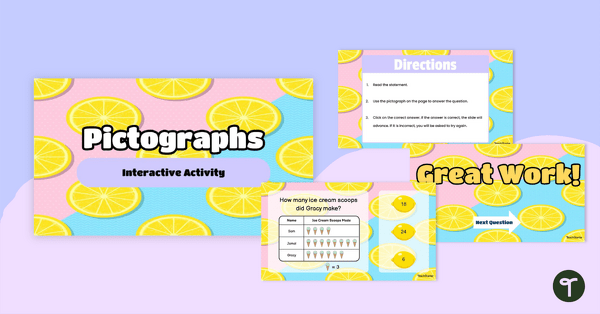
Pictographs - Interactive Activity
Use this fun and engaging interactive activity to aid students. in practicing their pictograph interpretation skills.
- Plus Plan
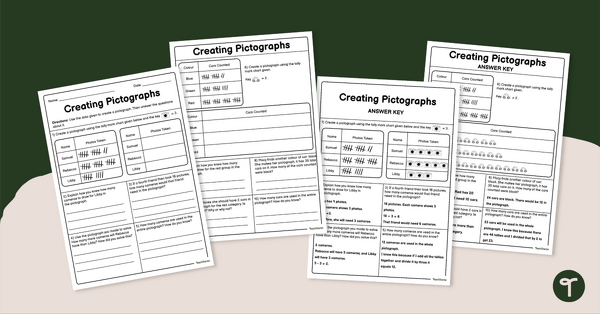
Creating Pictographs Worksheet
Use this engaging worksheet to practice creating and reading pictographs.
- Plus Plan
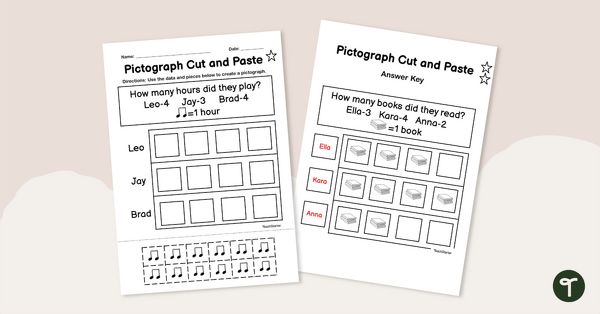
Pictograph Cut and Paste Worksheet
Use this fun cut-and-paste worksheet to build student understanding of pictographs and encourage them to practice their fine motor skills.
- Plus Plan
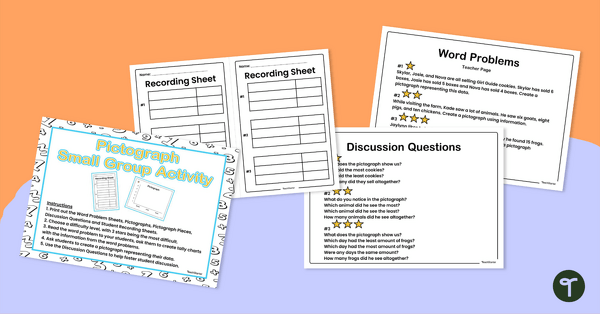
Create a Pictograph – Small Group Activity
Teach students how to create simple pictographs using data from word problems with this small group activity.
- Plus Plan
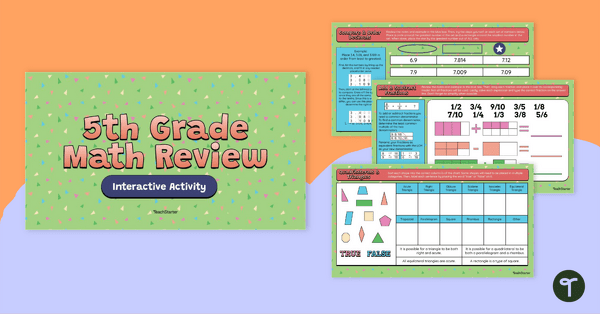
5th Grade Math Review – Google Slides Interactive Activity
Review important 5th-grade math standards with a student-led interactive activity that covers 12 different mathematical concepts.
- Plus Plan
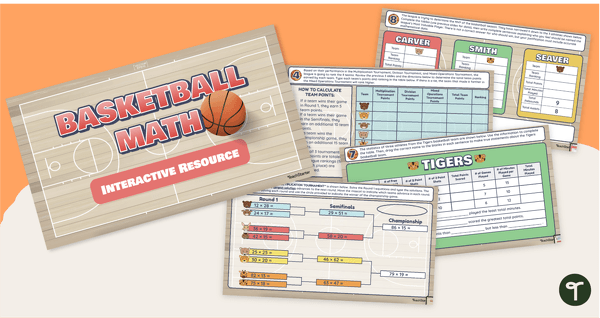
Basketball Math- Interactive Slides
Tame the March “Mathness” by solving problems and analyzing data with an exciting basketball-themed interactive activity.
- Plus Plan
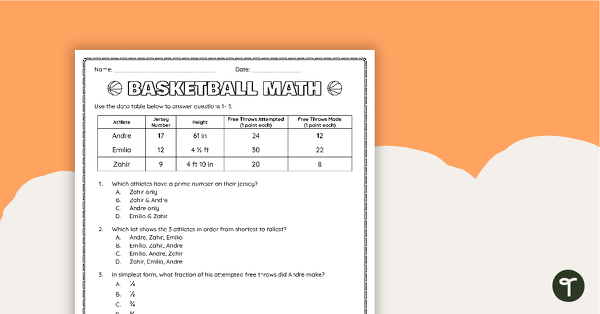
Basketball Math- Mixed Operations Worksheet
Practice multiplication, division, fractions, and problem-solving skills with a high-interest basketball-themed math task
- Plus Plan
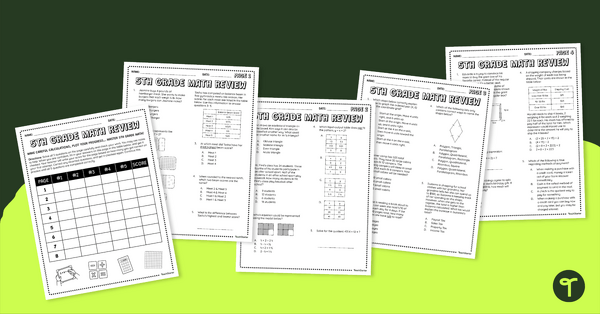
5th Grade Math Review – Test Prep Packet
Encourage your students to work through 8 pages of 5th-grade math problems while charting their progress to measure their success.
- Plus Plan
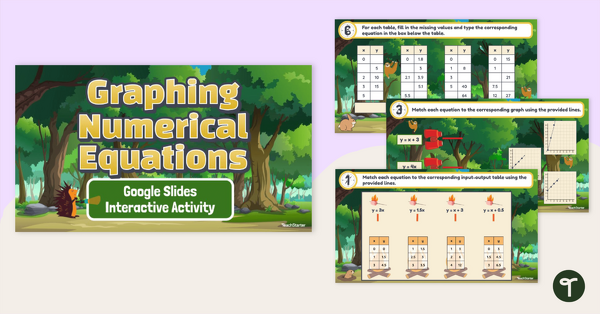
Graphing Numerical Equations – Google Slides Interactive Activity
Recognize and analyze patterns in graphs, input-output tables, and equations with this interactive activity.
- Plus Plan
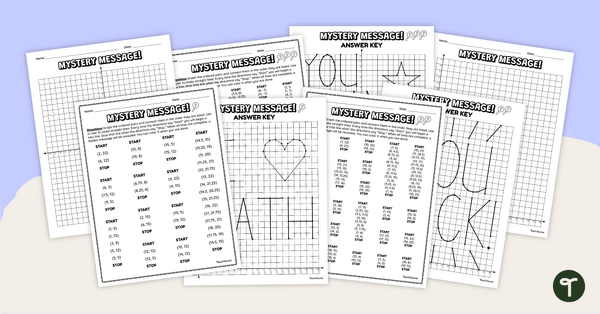
Coordinate Grids Mystery Pictures
Practice plotting on coordinate grids with this set of differentiated mystery pictures.
- Plus Plan
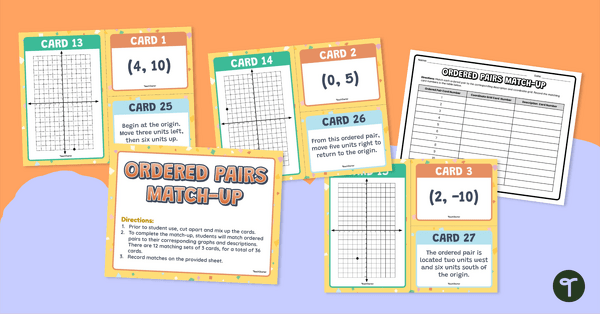
Ordered Pairs Match-Up
Practice plotting ordered pairs and describing the process for graphing with this match-up activity.
- Plus Plan
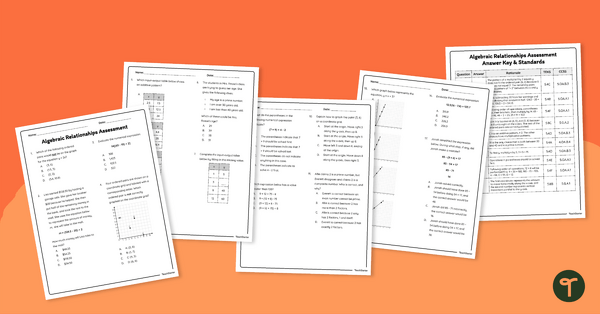
5th Grade Algebraic Relationships Assessment
Assess student understanding of prime and composite numbers, numerical expressions, graphing numerical patterns, and more with this math assessment.
- Plus Plan
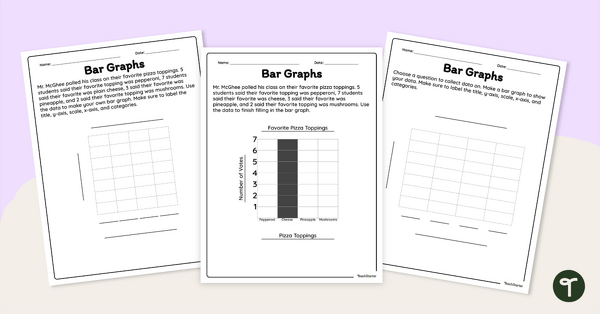
Creating a Bar Graph – Worksheet
Interpret data and create bar graphs with this worksheet.
- Plus Plan
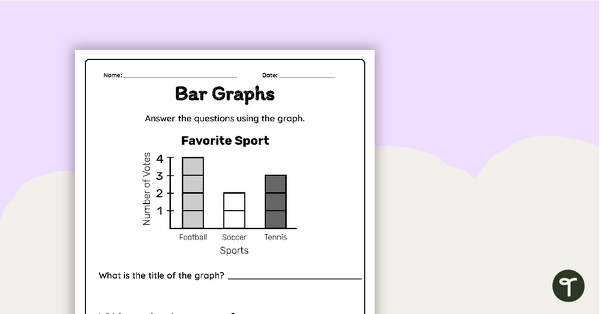
Interpreting a Bar Graph – Worksheet
Interpret information from a bar graph and answer questions with this worksheet.
- Plus Plan
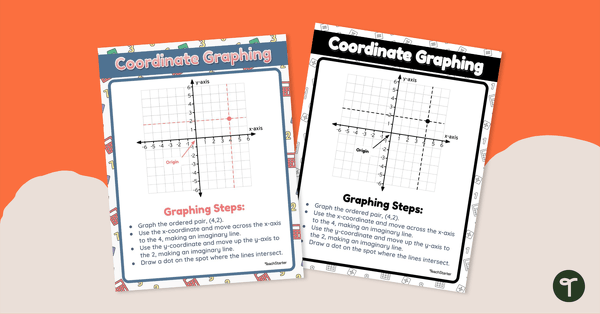
Coordinate Graphing Poster
Use this math reference sheet with your students when learning about coordinate graphing.
- Plus Plan
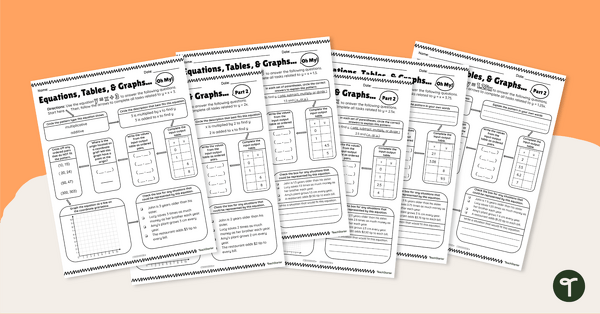
Equations, Tables, and Graphs, Oh My! – Differentiated Worksheets
Use these differentiated worksheets to practice using equations to create patterns within input-output tables and graphs.
- Plus Plan
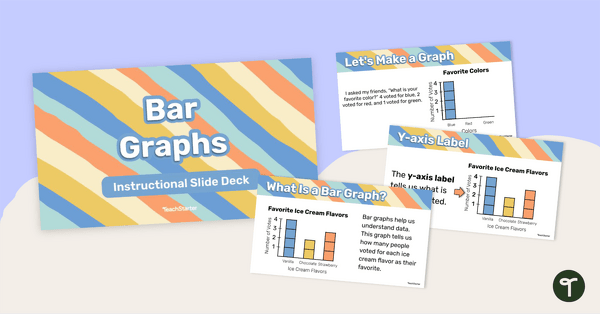
Bar Graphs – Instructional Slide Deck
Learn about the features and how to create a bar graph with this 25-page instructional slide deck.
- Plus Plan
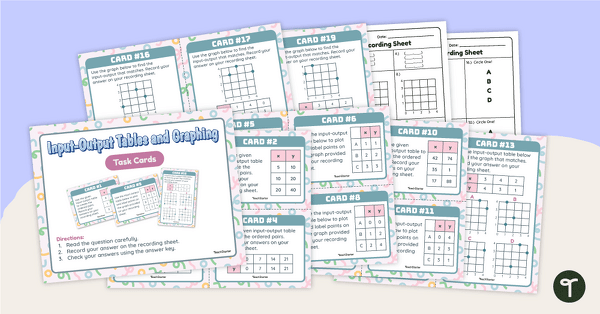
Input-Output Tables and Graphing Task Cards
Practice reading input-output tables and plotting points in the first quadrant with this set of task cards.
- Plus Plan
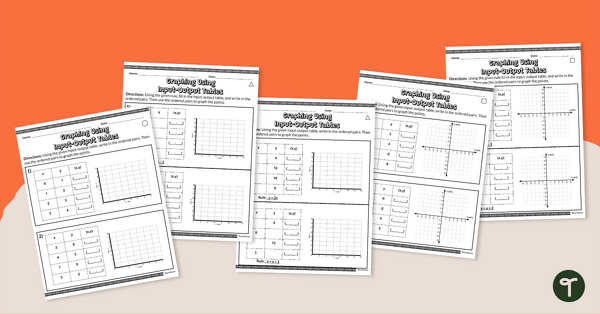
Graphing Using Input-Output Tables – Differentiated Worksheets
Use data from input-output tables to graph points with this set of differentiated worksheets.
- Plus Plan
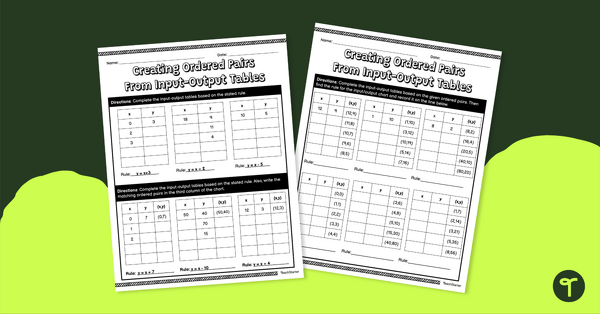
Creating Ordered Pairs From Input-Output Tables – Worksheet
Create ordered pairs from an input-output table and determine the rule for each table with this worksheet.
- Plus Plan
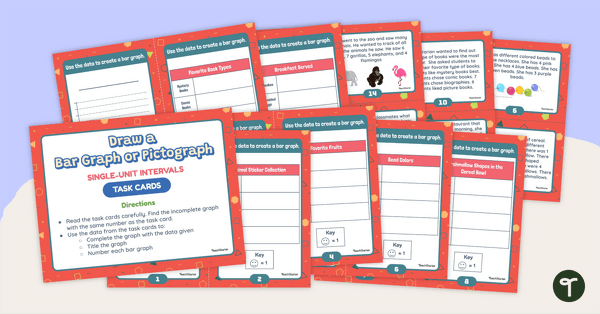
Draw a Bar Graph and Pictograph Task Cards (Single-Unit Intervals)
Practice drawing single-unit bar graphs and pictographs with this set of task cards.
- Plus Plan
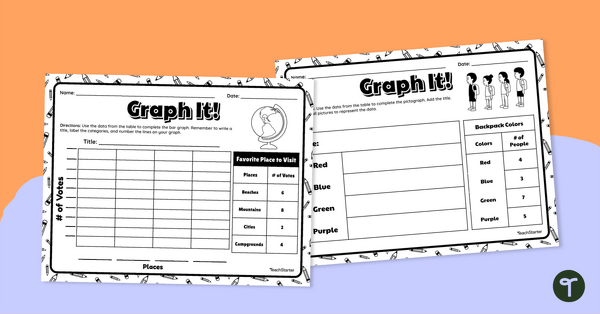
Graph It! Worksheet (Single-Unit Intervals)
Draw a single-unit picture graph and bar graph to represent data with this worksheet.
- Plus Plan
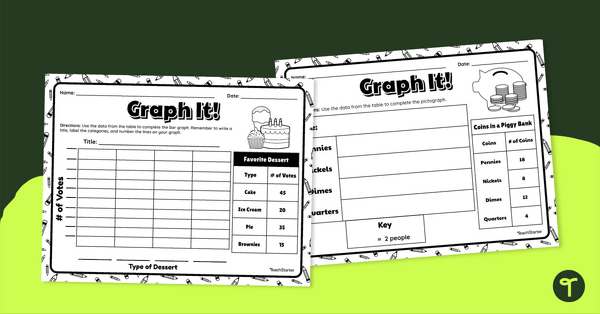
Graph It! Worksheet (Scaled Intervals)
Draw a scaled picture graph and bar graph to represent data with this worksheet.
- Plus Plan
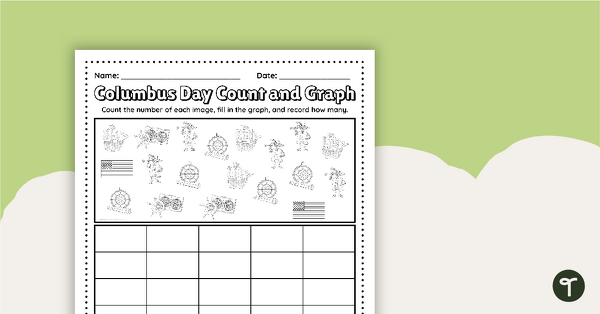
Columbus Day Count and Graph Worksheet
Practice counting objects with a Columbus Day count and graph worksheet.
- Plus Plan
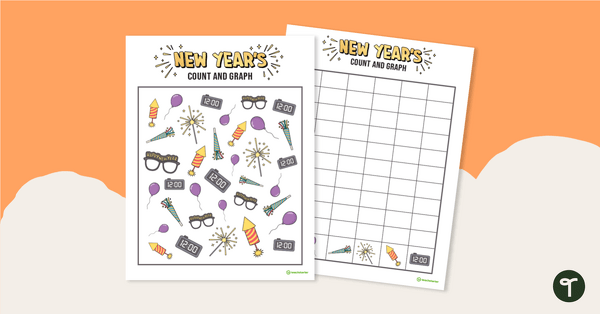
Count and Graph – New Year's Edition
Celebrate the new year by counting festive images and notating their totals as a bar graph.