Graphs and Data Teaching Resources
- Plus Plan
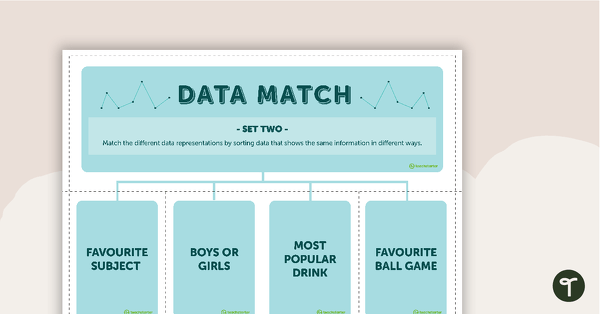
Data Match-Up Cards (Set 2)
A match-up activity for students to use when exploring data.
- Plus Plan
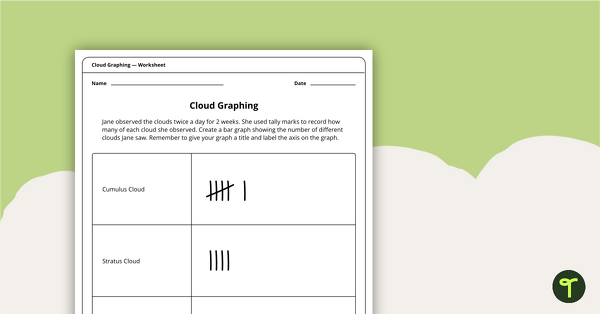
Cloud Graphing Activity
A worksheet to use when graphing cloud observations.
- Plus Plan
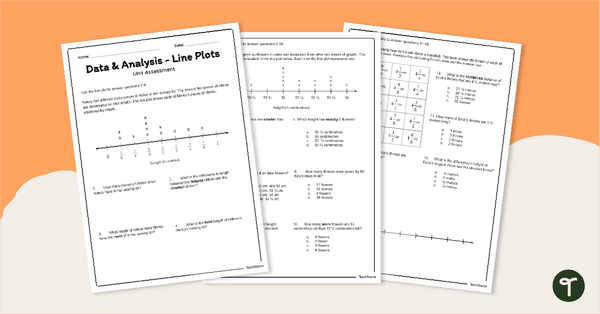
Line Plots / Dot Plots - Year 5 Assessment
Assess student understanding of reading and creating dot plots/line plots with a printable assessment for Year 5.
- Plus Plan
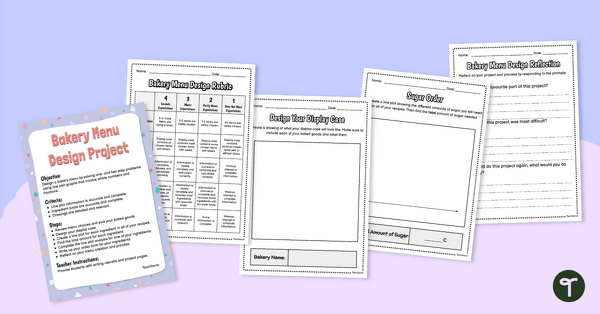
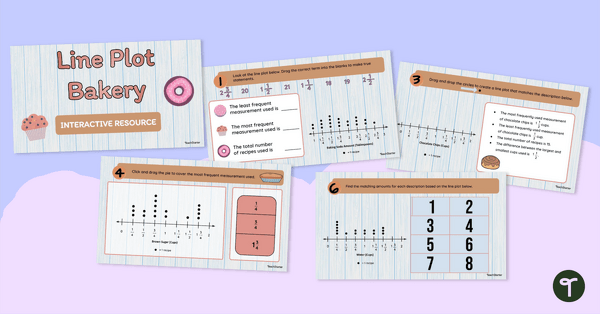
Line Plot Project: Bakery Menu Design
Make learning about maths as sweet as your students' favourite treats with this project based learning line plots exercise!
- Plus Plan
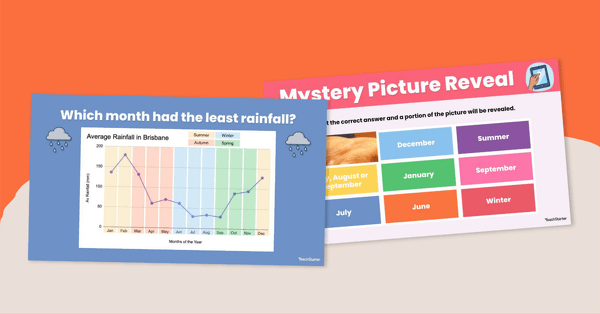
Interpreting Line Graphs Interactive Resource
Use this digital activity to teach students about interpreting real-life data represented as a line graph showing how measurements change over a period of time.
- Plus Plan
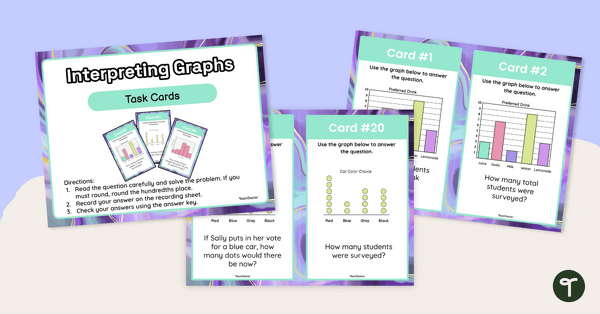
Interpreting Graphs Task Cards
Use this set of task cards students to practise interpreting column graphs, histograms and line plots.
- Plus Plan
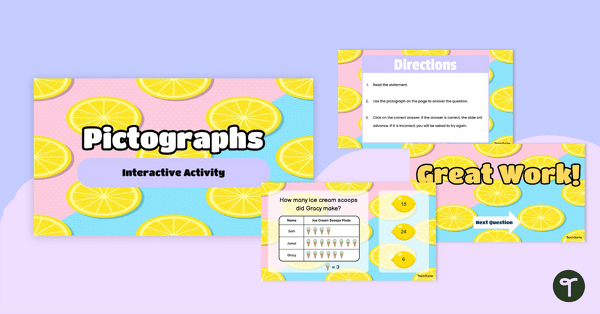
Pictographs - Interactive Activity
Use this fun and engaging interactive activity to aid students. in practicing their pictograph interpretation skills.
- Plus Plan
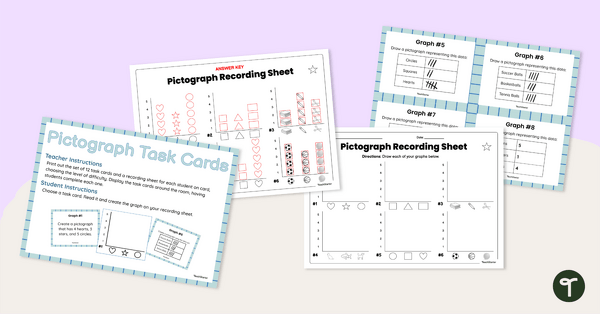
Graphing (Pictographs) Task Cards
Get graphing! Use these levelled pictograph task cards to show students a variety of data collection records, and have them create pictographs to represent that data.
- Plus Plan
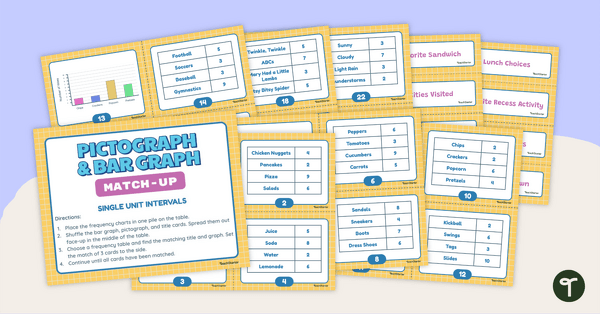
Pictograph and Bar Graph Match-Up (Single-Unit Intervals)
Use data analysis skills to match frequency tables with a corresponding bar graph or pictograph.
- Plus Plan
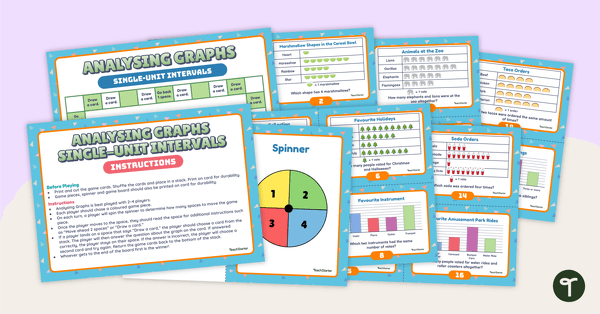
Analysing Graphs (Single-Unit Intervals) Board Game
Sharpen data analysis skills when solving problems with information presented in a single-unit picture or column graph with this board game.
- Plus Plan
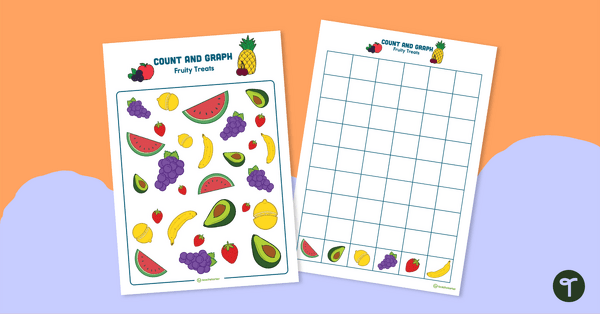
Count and Graph – Fruity Treats
A fruit-themed hands-on activity to introduce graphing skills.
- Plus Plan
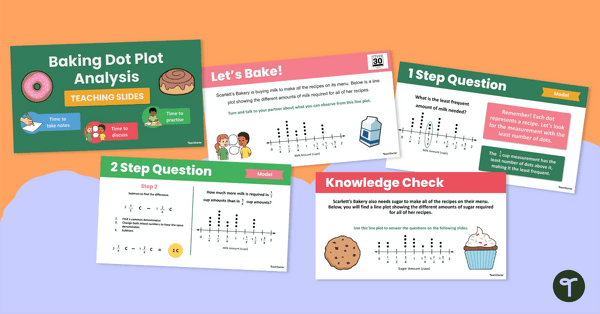
Baking Dot Plot Analysis Teaching Slides
Explore the sweet side of graphs and data with this bakery-themed dot plot resource, supporting your students' abilities to interpret dot plots!
- Plus Plan
Search and Find – Year 1 Halloween Maths Worksheet
Get your students counting up to Halloween with this fun search and find maths worksheet.
- Plus Plan
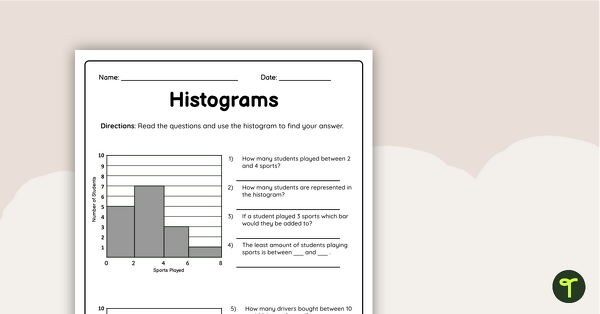
Histograms Worksheet
Encourage your students to practise reading and creating histogram graphs using this double-sided worksheet with answer key included.
- Plus Plan
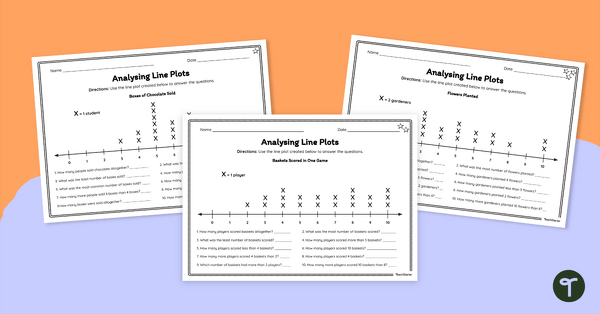
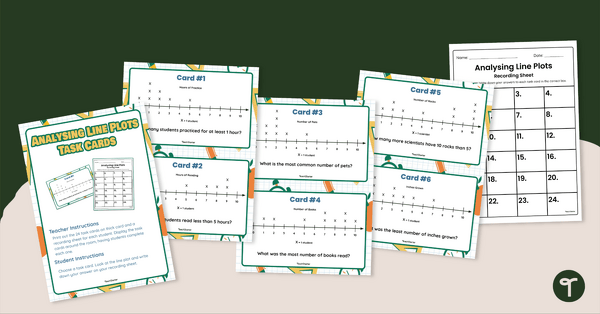
Analysing Line Plots – Differentiated Worksheets
Empower your students to become proficient data interpreters with this set of differentiated line plot worksheets.
- Plus Plan
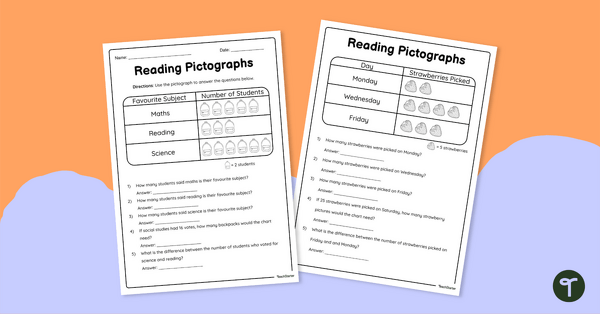
Reading Pictographs - Worksheets
Use this double-sided worksheet to enable students to practise reading and interpreting pictographs.
- Plus Plan
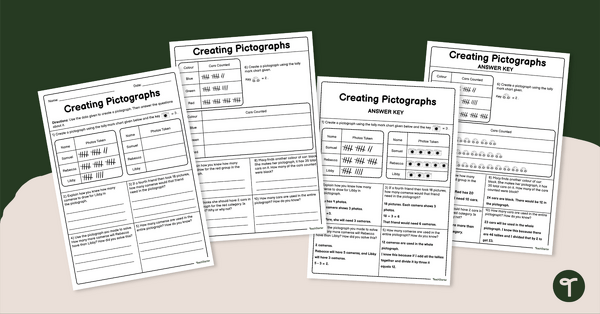
Creating Pictographs Worksheet
Use this engaging worksheet to practice creating and reading pictographs.
- Plus Plan
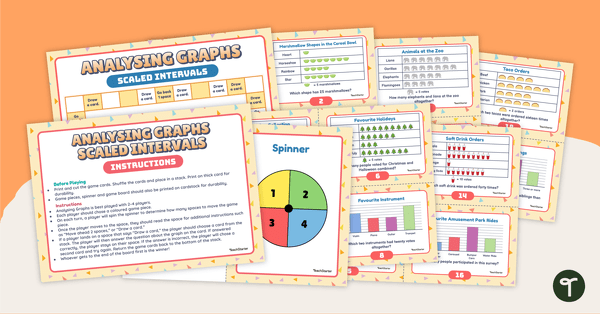
Analysing Graphs (Scaled Intervals) Board Game
Use this board game to sharpen data analysis skills when solving problems with information presented in a scaled picture or column graph.
- Plus Plan
Picture Graph Playoff – Maths Game
A fun picture graph game for students to consolidate gathering and representing data.
- Plus Plan

Data Maths Investigation - Should I Buy It?
A mathematics investigation involving data collection and representation, embedded in a real-world context.
- Plus Plan
Statistics Word Wall Vocabulary
A comprehensive selection of statistics vocabulary for use on a Mathematics Word Wall.
- Plus Plan
Data Match-Up Cards (Set 3)
A match-up activity for students to use when exploring data.
- Plus Plan
Dot Plot Bakery Interactive Activity
Strengthen dot plot skills with this bakery-themed interactive activity, designed to help students practise creating and analysing dot graphs in a fun, structured way.
- Plus Plan
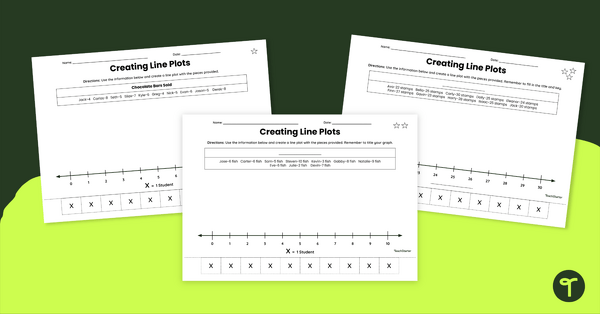
Creating Line Plots Differentiated Cut and Paste Worksheet
Guide students to create line plots with this differentiated cut and paste worksheet.
- Plus Plan
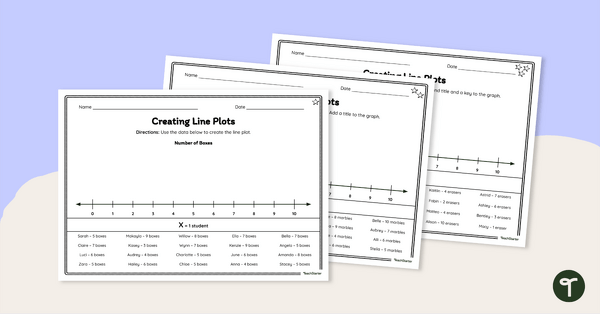
Differentiated Line Plot Worksheet
Guide your students to represent data with this differentiated line plot worksheet.
- Plus Plan

Goal Labels - Data Representation and Interpretation (Lower Primary)
Eleven Data Representation and Interpretation Goal Labels for lower primary.
- Plus Plan
Analysing Dot Plots Task Cards
Strengthen data analysis skills by interpreting dot plots with this set of 24 task cards.
- Plus Plan
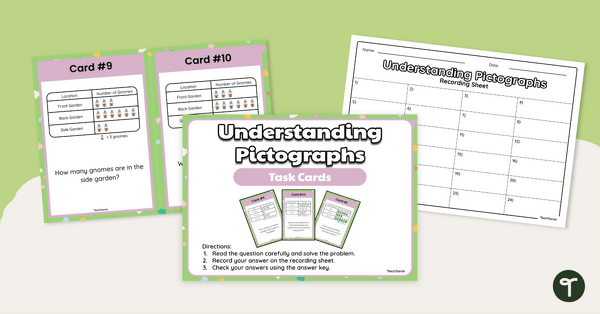
Understanding Pictographs - Task Cards
Use this set of task cards to practise reading and interpreting pictographs and bar graphs
- Plus Plan
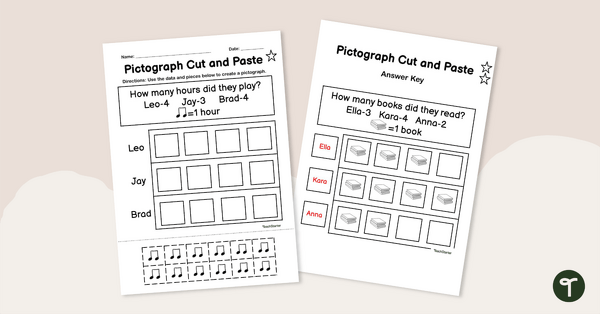
Pictograph Cut and Paste Worksheet
Use this fun cut-and-paste worksheet to consolidate student understanding of pictographs, and encourage them to practise their fine motor skills.
- Plus Plan
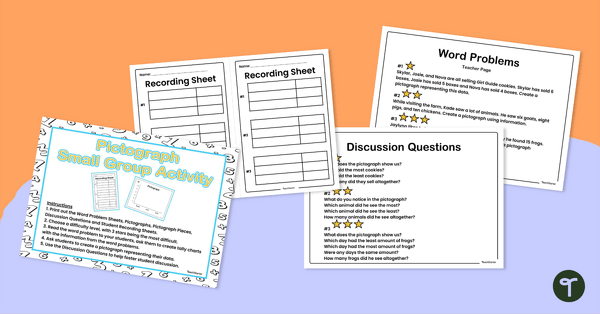
Create a Pictograph - Small Group Activity
Introduce the concept of a pictograph, and teach students how to create simple pictographs based on data from in a word problems.
- Plus Plan
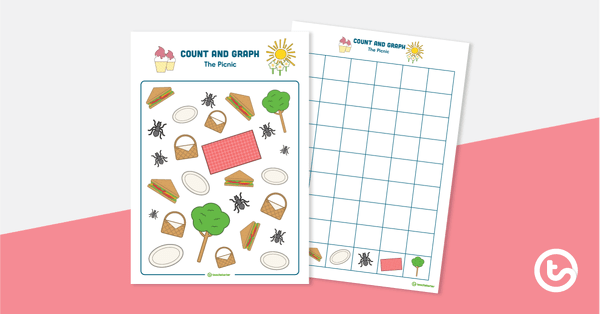
Count and Graph – The Picnic
A picnic-themed hands-on activity to introduce graphing skills.
- Plus Plan
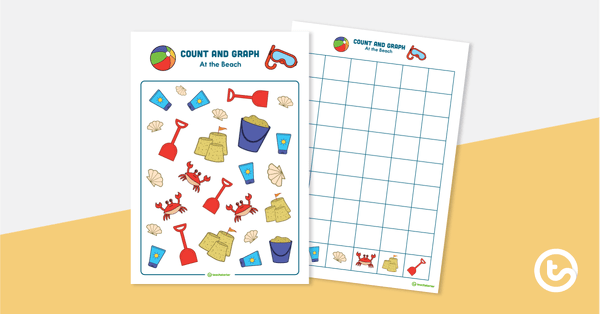
Count and Graph – At the Beach
A beach-themed hands-on activity to introduce graphing skills.