Graphic Organizers for Teachers
The blank graphic organizers and printable graphic organizer templates you need most for your elementary classroom are here! Help your students learn to brainstorm ideas and organize information with editable templates you can customize for your classroom.
Carefully designed and curated by our expert teacher team, each of the maps, charts, and diagrams in this collection of templates has been created with the needs of students in mind, and many are already aligned to the curriculum to save you much-needed time in your lesson planning.
You'll find:
- Printable Venn Diagram templates
- T-charts
- KWLs
- Story maps
- Concept diagrams
- Concept maps
- Knowledge maps
- Cognitive organizers
- Advance organizers
- Brainstorming templates
- More classic organizer examples
Not familiar with this teaching tool, or just looking for some fresh ideas for using them in the classroom? Read on for a primer from our teacher team!
What Is a Graphic Organizer?
A graphic organizer, by definition, is a visual guide that breaks down the relationships between ideas, vocabulary, or facts within a learning task. These learning tools scaffold learning for students, allowing them literally construct knowledge. Pretty neat, huh?
Graphic organizers can take the form of templates, charts, or diagrams and be specific to one topic or generalized for use across a range of subjects.
Printing blank templates allows students to use the tool to design their learning, explore relationships between concepts and use their evaluation and judgment skills to determine where information should be added to the organizer.
Types of Graphic Organizer Examples
So what are the different types of graphic organizers in this collection? Let's take a look at some examples and how to use them!
Concept Maps
The term "map" for this graphic organizer refers to the fact that it shares some similarities with a traditional map.
A map of a country or state can visually represent the geographic layout of different places and their relationships. Similarly, a concept map visually represents the connections and relationships between various ideas or concepts. This helps students organize their thoughts and understand the relationships between different topics, as well as helping kids understand the overall structure of a topic.
Venn Diagrams
A Venn diagram is used to show the logical relationships between two or more sets of items. The Venn diagram is named for John Venn, a mathematician, logician, and philosopher known for his work in probability.
Although a classic Venn diagram is made up of overlapping circles, other shapes can be used with this graphic organization tool. And while a Venn Diagram is often made up of just two or three circles, some forms can encompass larger numbers of shapes.
Especially useful in math and ELA classes, a Venn diagram can help students easily analyze similarities and differences between characters, objects or concepts. For example, a student might use a Venn diagram in math to sort and classify numbers or geometric shapes.
Story Maps
A story map is a graphic organizer that can help ELA students understand the elements of a story — concepts such as characters, setting, plot and resolution.
This handy tool gives kids a visual outline of the story's structure and helps students identify key elements and their relationships, plus it helps them track plot progression.
KWL Charts
KWL stands for Know-Want to know-Learned, and charts built around this acronym count as graphic organizers! They're used to activate prior knowledge, guide inquiry-based learning and track learning progress.
The goal is for students to fill in what they already know about a topic, what they want to learn, and what they have learned. This gets kids to engage with the content and ask questions!
Cause and Effect Charts
Typically used in social studies or science, cause and effect charts help students understand the relationship between events or actions.
For example, students can use one of these charts to identify the causes and consequences of a specific event in history or to analyze cause-and-effect relationships in a science experiment.
Flowcharts
Flowcharts use symbols and arrows to represent a sequence of steps or events. This type of organizer tends to be used in subjects like science and math to help kids visualize processes, procedures and problem-solving strategies.
In science, for example, a student might use a flowchart to illustrate the steps of the water cycle. They could use symbols and arrows to represent each stage, starting with "Evaporation," followed by "Condensation," "Precipitation" and "Collection." Arrows would then connect the steps logically, showing the water flow through the cycle.
Mind Maps
Yup, we have yet another kind of map on this list! Mind maps are diagrams that start with a central idea and branch out to represent related concepts or ideas visually.
You can use these organizers for brainstorming, organizing thoughts and making connections between different pieces of information, and they come in handy across a broad range of school subjects.
In writing, for example, a student could use a mind map to generate ideas or outline an essay. Meanwhile, in science class, mind maps can help a student explore different branches of a scientific concept or create visual summaries of key scientific principles.
Comparison Charts
Comparison charts help students analyze similarities and differences between two or more objects, concepts, or ideas. They are used to compare and contrast information, such as characteristics of animals, historical figures or different geographical locations.
Let's say a student needs to compare two animals in science class — an elephant and a giraffe.
They could use a comparison chart with columns for different attributes like "Size," "Habitat," "Diet" and "Physical Features." Under each column, they would then fill in the specific characteristics and compare how elephants and giraffes are different or share similarities.
Timelines
As a graphic organizer, a timeline provides a structured framework for organizing and presenting information visually. Students can see the progression of events over time, making it easier to understand historical developments, story plots or the sequence of steps in a process.
A timeline typically includes a horizontal or vertical line representing a specific timespan. Specific points or intervals are marked along the line to indicate specific events or periods. Events are then labeled and positioned relative to when they happen — this way kids can more easily grasp the order of each event and how long each one lasted.
Problem-Solution Charts
Problem-solution charts help students analyze problems and create potential solutions. They typically include sections for identifying the problem, brainstorming possible solutions and evaluating the best way to move forward.
This organizer can help kids with planning out a project like solving the problem of waste in the cafeteria. They could identify that the garbage can is always full of items that could be recycled, brainstorm ways to address the issue, and come up with a plan to add recycling bins beside the garbage can.
T-Charts
T-Charts are fairly simple graphic organizers.
They divide information into two columns — a line at the top and a line down the center give this organizer its name — and help students compare and contrast information or categorize data into two categories.
Benefits of Graphic Organizer Templates
Should you use this tool in your classroom to support your students' learning goals? We can't tell you that — but just look at the benefits of graphic organizers!
A graphic organizer helps students organize their ideas, drawing out relationships between ideas or concepts and expressing them in a graphic display. These visual representations or guides may also help students to retain information.

Not sure which organizer you and your students need?
Don't worry; this collection of teaching resources has them all covered with resources created by teachers for teachers, including free printables and templates to scaffold learning in social studies, ELA, and beyond.
- Plus Plan
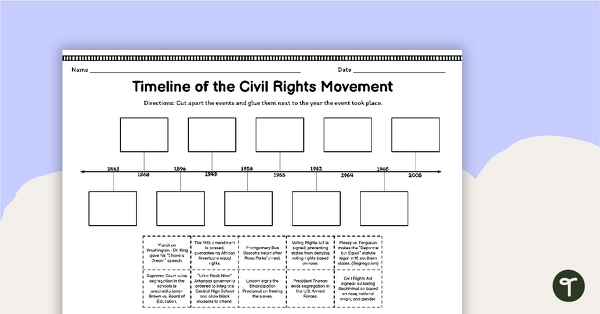
Timeline of the Civil Rights Movement Worksheet
Craft an chronological timeline for students to visually model the events occurring during the Civil Rights Movement.
- Plus Plan
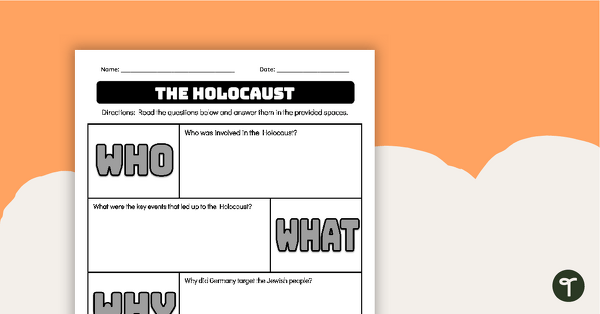
The Holocaust - Note-Taking Template
Provide your learners with an organized note-taking method with a Holocaust note-taking template.
- Plus Plan
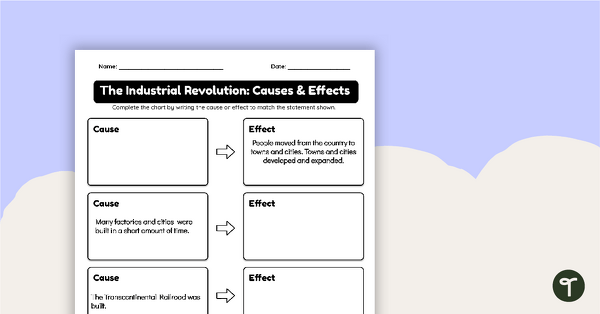
Industrial Revolution Causes and Effect Graphic Organizer
Identify the causes and effects of the Industrial Revolution on American society with an Industrial Revolution worksheet.
- Free Plan
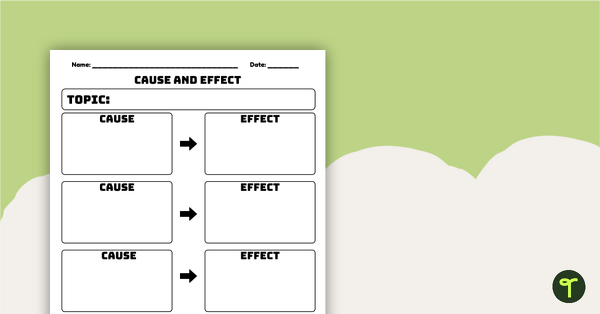
Free Cause and Effect Graphic Organizer
Practice identifying cause and effect with a blank cause and effect graphic organizer.
- Plus Plan
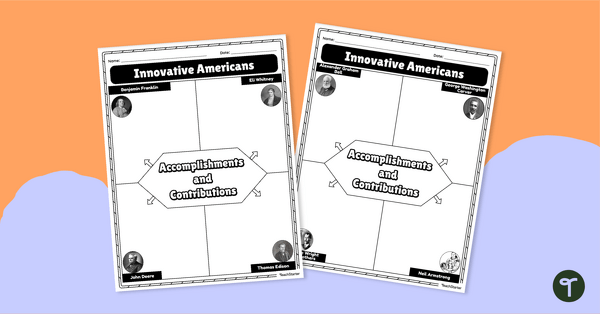
Innovative Americans Graphic Organizer
Record and remember key facts and details about American inventors with a printable graphic organizer.
- Plus Plan
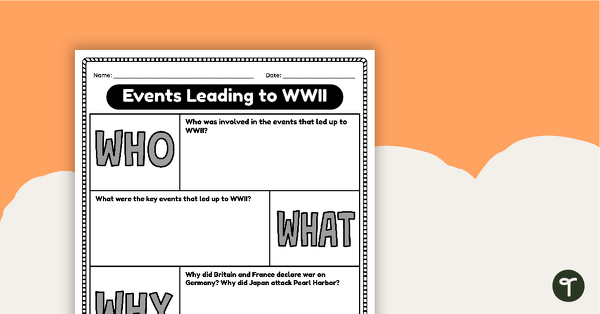
Events Leading to WWII - Note Taking Template
Provide your learners with an organized method of note-taking with a World War II note-taking template.
- Plus Plan
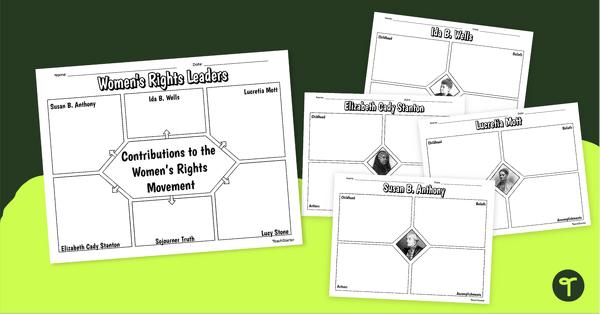
Women's Rights Leaders Graphic Organizer
Organize learning about famous historical figures of the Women’s Rights Movement with a pack of note-taking worksheets.
- Plus Plan
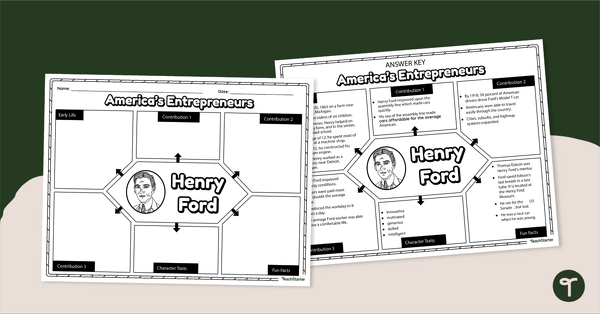
Henry Ford Graphic Organizer
Organize learning about Henry Ford’s contribution to the American automobile industry with a graphic organizer worksheet.
- Plus Plan
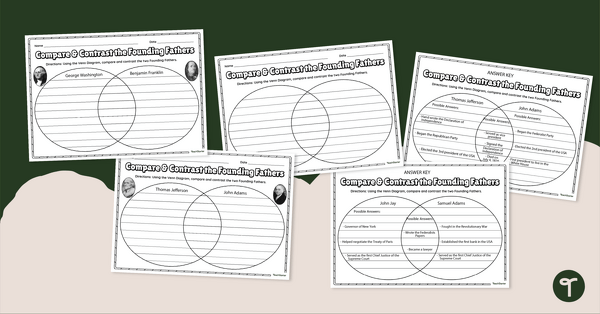
Founding Fathers Compare/Contrast Worksheet
Compare and contrast America’s founding fathers with a set of compare and contrast Venn diagrams for kids.
- Plus Plan
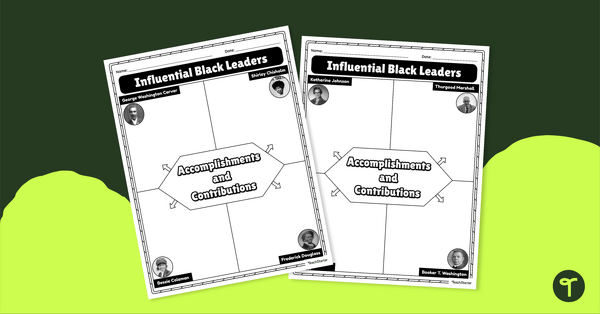
Influential Black Leaders Research Organizers
Dive into a research project on influential Black leaders with a set of Historical Figure graphic organizers.
- Plus Plan
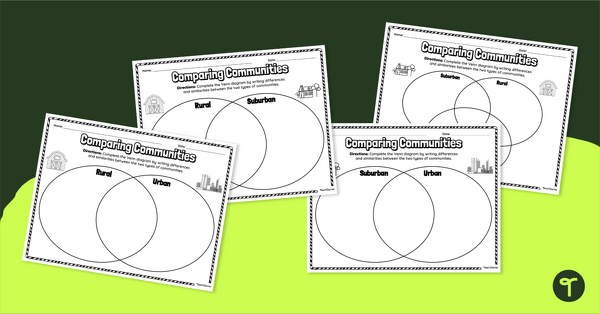
Comparing Communities - Venn Diagram Worksheet
Compare and contrast rural, urban, and suburban communities with a set of Venn diagram graphic organizers.
- Plus Plan
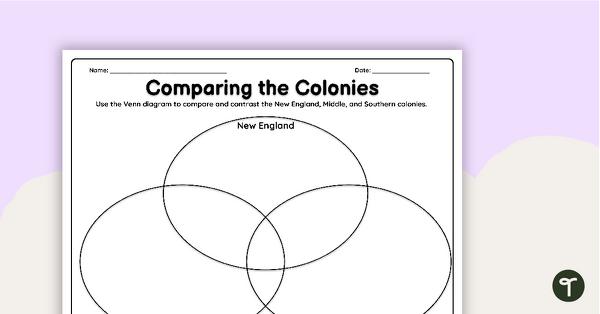
13 Colonies Venn Diagram Worksheet
Compare and contrast the New England, Middle, and Southern colonies with a Venn diagram graphic organizer.
- Plus Plan
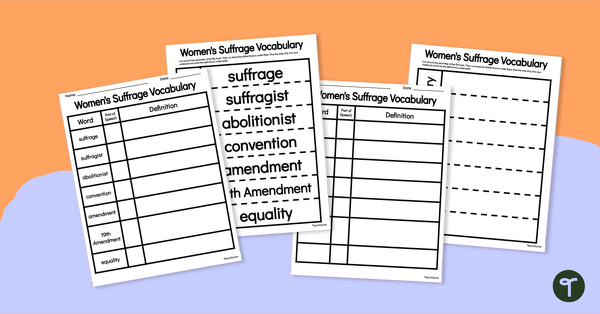
Women's Suffrage Vocabulary Graphic Organizers
Review and record key vocabulary surrounding the women's rights movement with a group of customizable vocabulary templates.
- Plus Plan
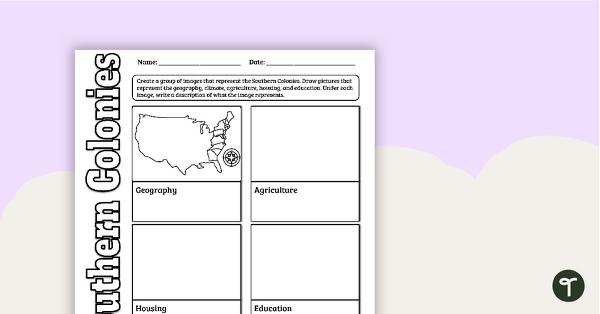
The Southern Colonies - Image Board Worksheet
Create a visual representation of the characteristics of the Southern colonies with an image board worksheet.
- Plus Plan
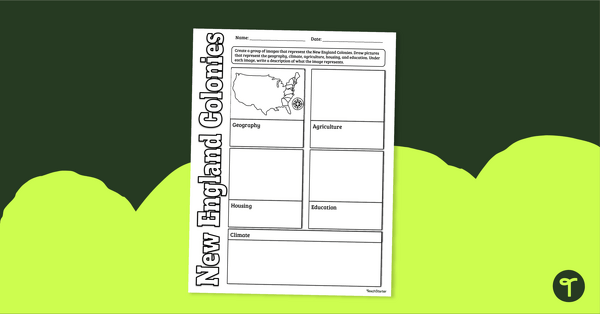
The New England Colonies - Image Board Worksheet
Create a visual representation of the characteristics of the New England colonies with an image board worksheet.
- Plus Plan
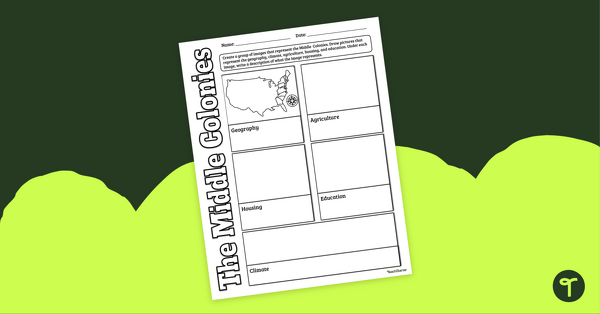
The Middle Colonies - Image Board Worksheet
Create a visual representation of the characteristics of the Middle colonies with an image board worksheet.
- Plus Plan
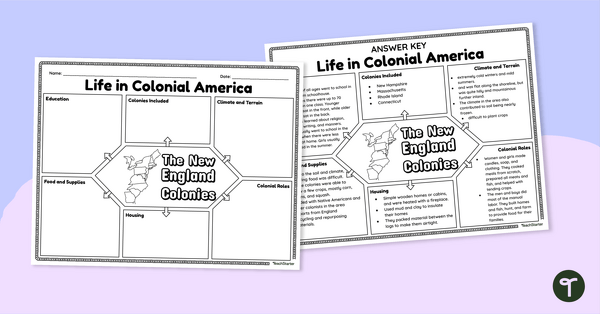
The New England Colonies - Graphic Organizer
Organize your students’ thoughts and knowledge of the original thirteen colonies with a graphic organizer.
- Plus Plan
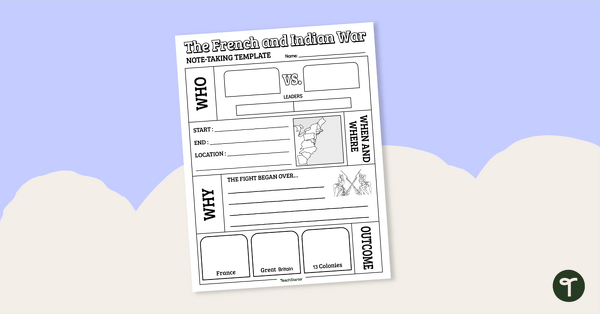
French and Indian War - Note Taking Template
Provide your learners with an organized method of note-taking with a French and Indian War note-taking template.
- Plus Plan
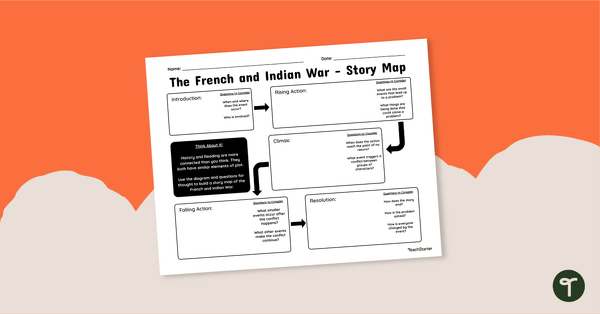
Social Studies Story Map - The French and Indian War
Combine literary plot diagrams and Social Studies standards with a French and Indian war story map worksheet.
- Plus Plan
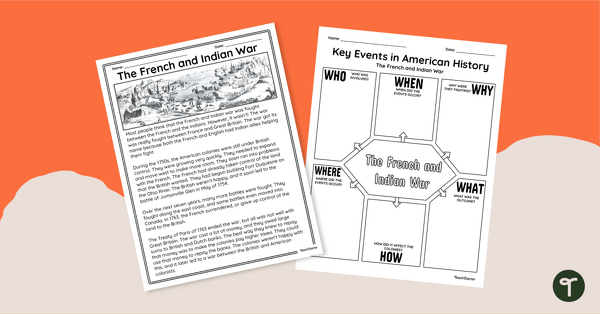
The French and Indian War - Passage and Graphic Organizer
Reveal another chapter in American History with a reading passage and graphic organizer worksheet on the French and Indian War.
- Plus Plan
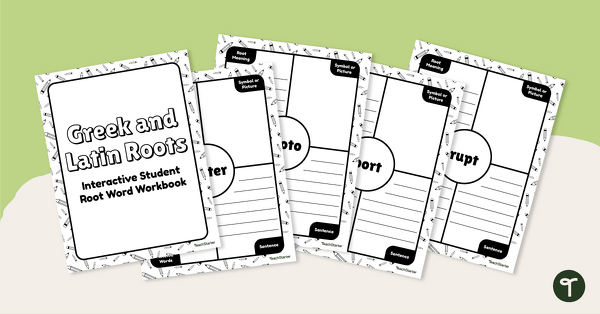
Greek and Latin Roots- Vocabulary Notebook
Enhance vocabulary containing Greek and Latin roots with a Google Slides Interactive vocabulary notebook. Also available in print format.
- Plus Plan
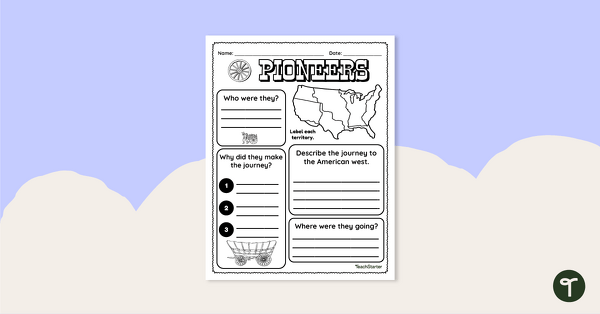
American Pioneers Graphic Organizer
Summarize the journey of the American Pioneer with a graphic organizer worksheet.
- Plus Plan
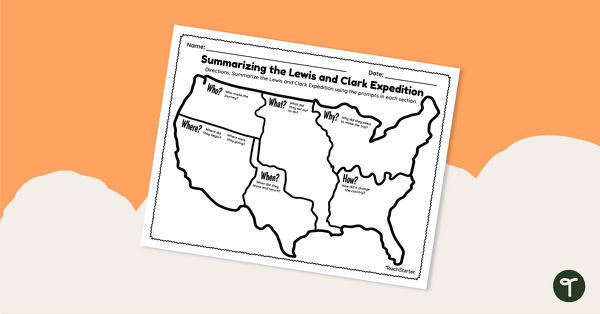
Lewis and Clark Expedition Worksheet - Graphic Organizer
Summarize a unit of study on the Lewis and Clark expedition with a who, what, where, when, and why graphic organizer.
- Plus Plan
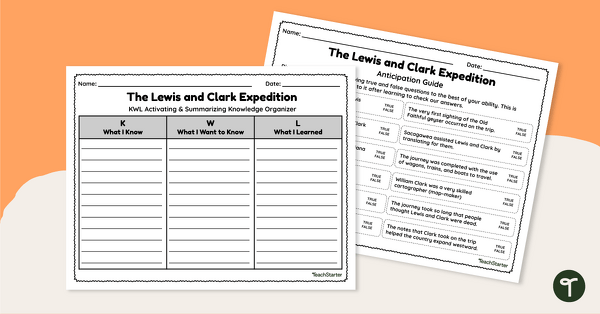
The Lewis and Clark Expedition - KWL-Anticipation Guide
Introduce a unit of study on the Lewis and Clark expedition with a KWL chart and anticipation guide.
- Plus Plan
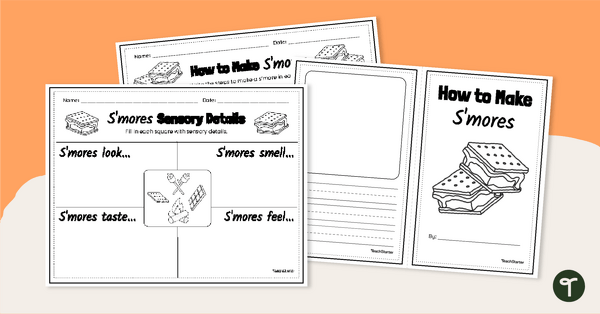
End-of-Year Writing – How to Make S'mores
Use this set of graphic organizers and mini-book to practice procedural writing.
- Plus Plan
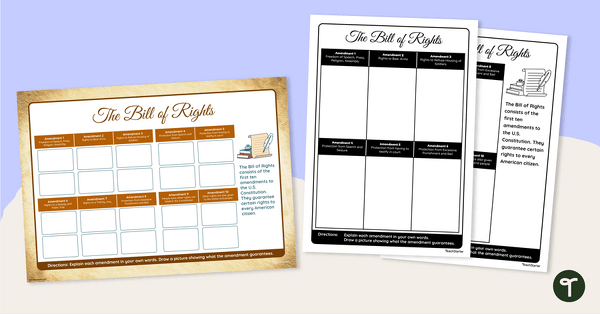
Explaining the Bill of Rights Organizer
Describe the concepts related to the first ten amendments of the United States Constitution.
- Plus Plan
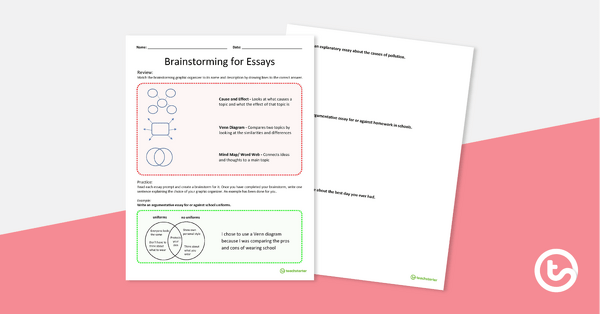
Brainstorming for Essays Worksheet
A worksheet to practice using Venn diagrams, mind maps, and cause and effect maps to brainstorm for various essays.
- Plus Plan
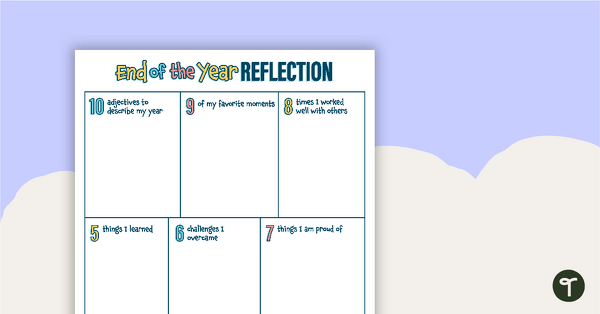
End of the Year Reflection
Reflect on the school year with this template for students.
- Plus Plan
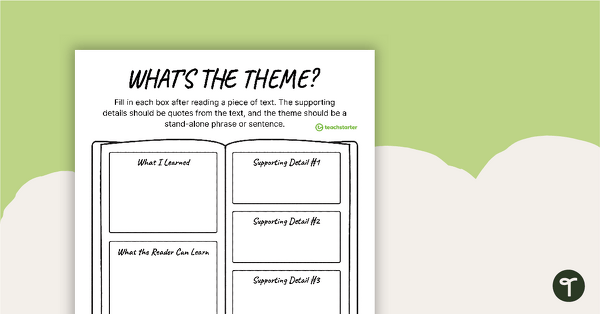
What's the Theme? - Graphic Organizer
Outline and determine the theme of a text with this 1-page graphic organizer worksheet.
- Plus Plan
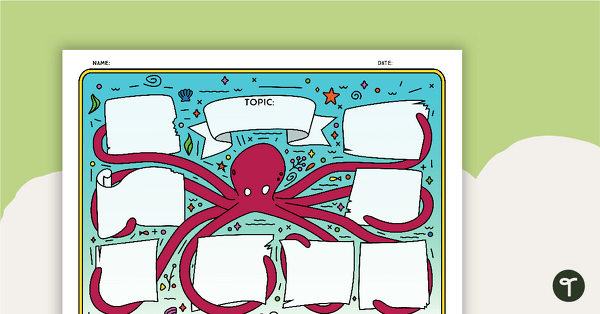
Mind Map Template – Octopus
A printable mind map to use when planning ideas with your students.
- Plus Plan
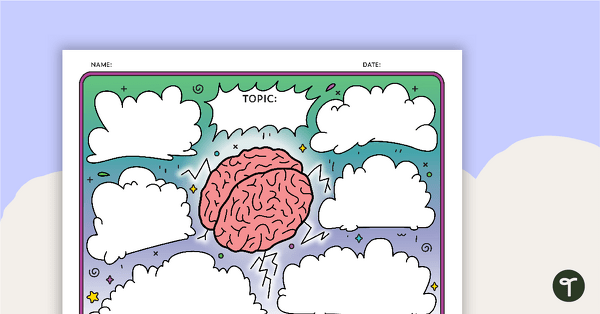
Mind Map Template – Brain
A printable mind map template for students to use when gathering thoughts and ideas.
- Plus Plan
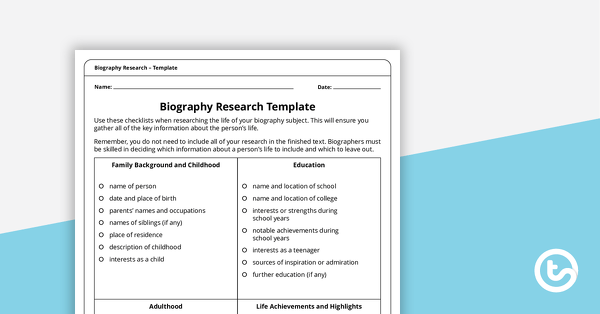
Biography Research Graphic Organizer
Provide students with this biography research graphic organizer to help them gather key life details and take organized notes for writing a well-structured biography.