Data
- Plus Plan
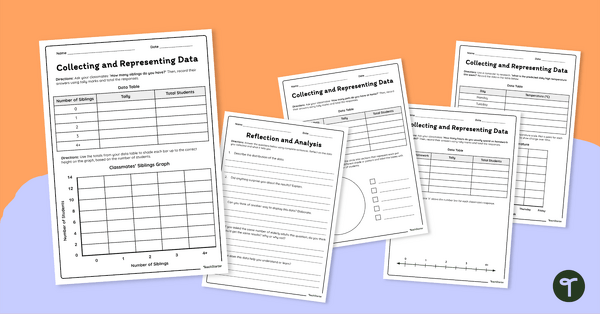
Collecting and Representing Data Worksheet Set
Download our collecting and representing data worksheet set to get your students collecting, organising and displaying data.
- Plus Plan
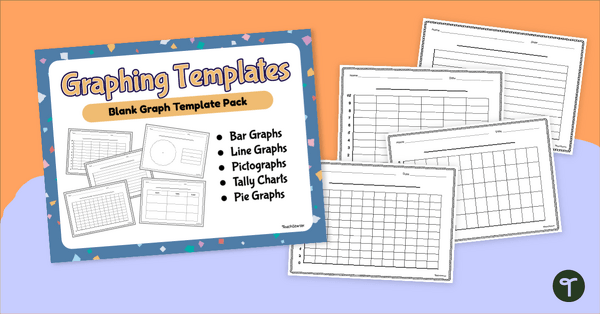
Blank Graph Template Pack
Construct your own graphs with a printable set of Blank Graph Templates.
- Plus Plan
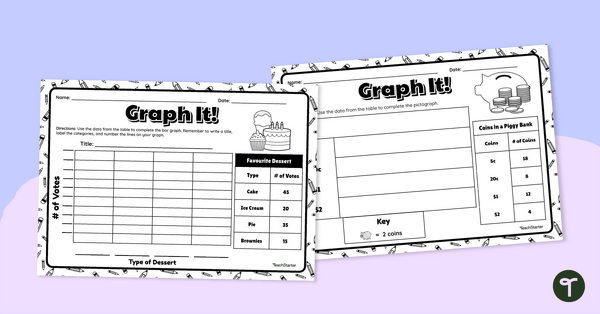
Graph It! Worksheet (Many-to-One Graphs)
Draw a scaled picture graph and bar graph to represent data with this worksheet.
- Plus Plan
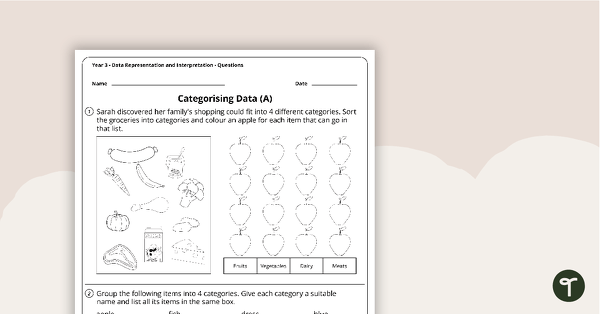
Data Representation and Interpretation Worksheets - Year 3
8 data representation and interpretation worksheets linked to the Australian Curriculum.
- Plus Plan
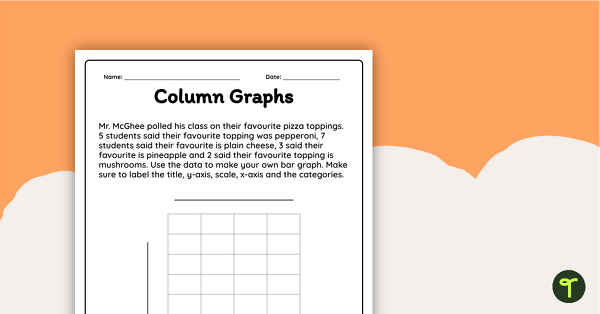
Creating a Bar Graph Worksheet
Interpret data and create a column graph display with this worksheet.
- Plus Plan
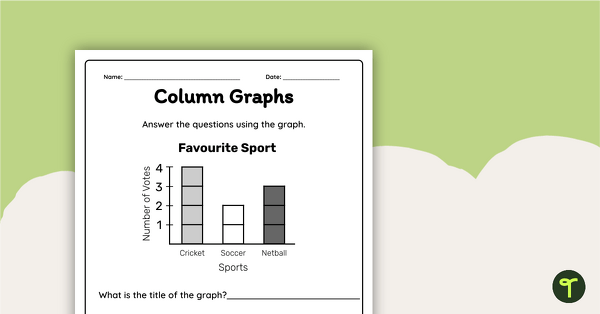
Interpreting a Column Graph Worksheet
Interpret information from a column graph and answer questions with this worksheet.
- Plus Plan
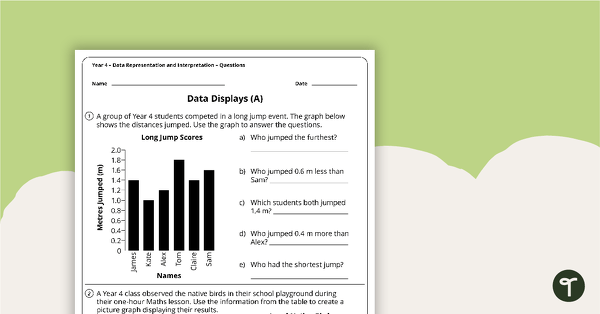
Data Representation and Interpretation Worksheets - Year 4
4 data representation and interpretation worksheets linked to the Australian Curriculum.
- Plus Plan
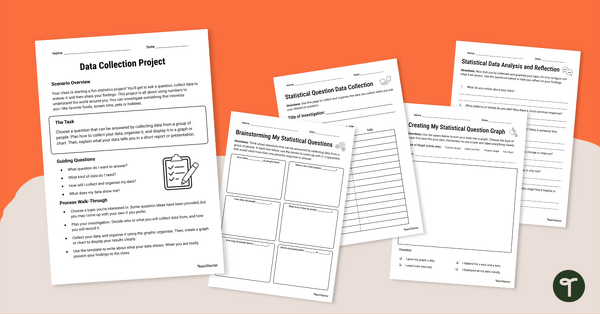
Data Collection Project
Complete this data collection project with your students to give them practise developing a statistical question, collecting data and displaying the results.
- Plus Plan

Types of Graphs Posters and Worksheets
A collection of posters displaying the different types of graphs along with matching worksheets to assist students with laying out graphs on the page.
- Plus Plan
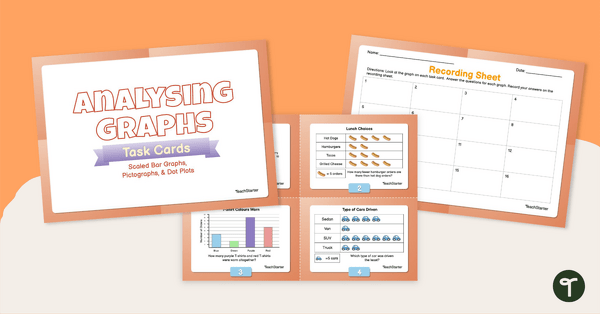
Analysing Graphs — Scaled Bar Graphs, Pictographs, & Dot Plots —Task Cards
Use data analysis skills to analyse scaled bar graphs, pictographs, and dot plots with this set of task cards.
- Plus Plan
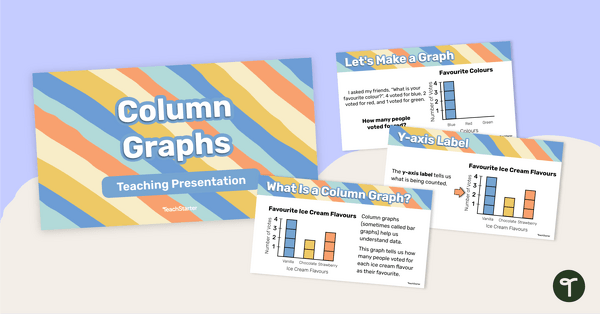
Column Graphs – Teaching Presentation
Learn all the features and how to construct a column graph with this 25-page teaching presentation.
- Plus Plan

Types of Graphs Posters
Show students the varying data displays they will encounter in their primary maths lessons with these colourful and easy-to-digest visual posters.
- Free Plan

Picture Graph Templates
A set of blank picture graph templates for students to represent data.
- Plus Plan
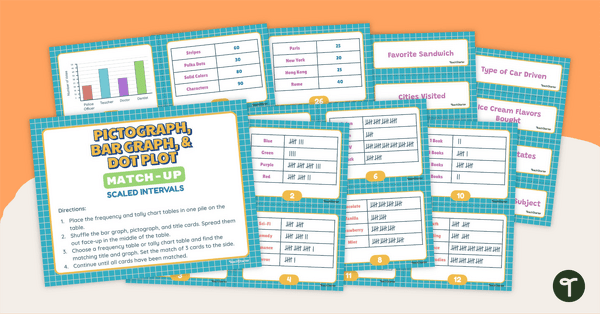
Pictograph, Bar Graph and Dot Plot Match-Up (Scaled Intervals)
Use data analysis skills to match tally charts and frequency tables with their corresponding bar graph, pictograph, or dot plot.
- Plus Plan

Analysing Graphs – Single-Unit Bar Graphs and Pictographs – Task Cards
Use data analysis skills to analyse bar graphs and pictographs with this set of task cards.
- Plus Plan
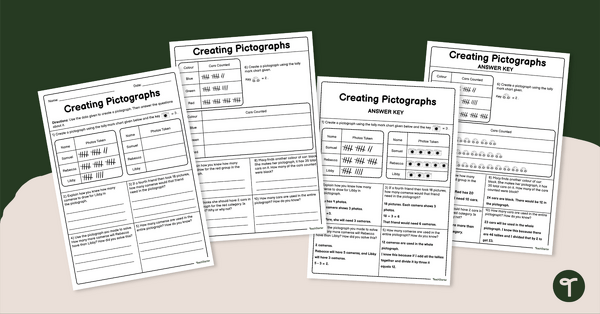
Creating Pictographs Worksheet
Use this engaging worksheet to practice creating and reading pictographs.
- Free Plan

Creating a Graph Using Digital Technologies
A worksheet that supports students when collecting initial data and creating a digital graph.
- Plus Plan
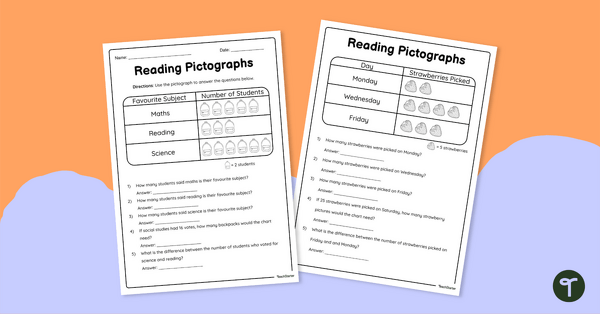
Reading Pictographs - Worksheets
Use this double-sided worksheet to enable students to practise reading and interpreting pictographs.
- Plus Plan
Maths Warm-Ups Interactive PowerPoint – Year 3
A PowerPoint providing a series of warm up activities for Year 3 students across the Mathematics curriculum.
- Plus Plan
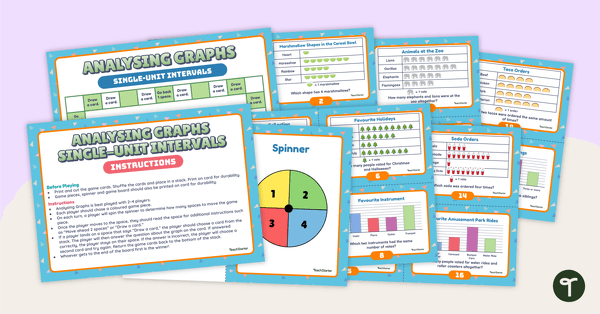
Analysing Graphs (Single-Unit Intervals) Board Game
Sharpen data analysis skills when solving problems with information presented in a single-unit picture or column graph with this board game.
- Plus Plan
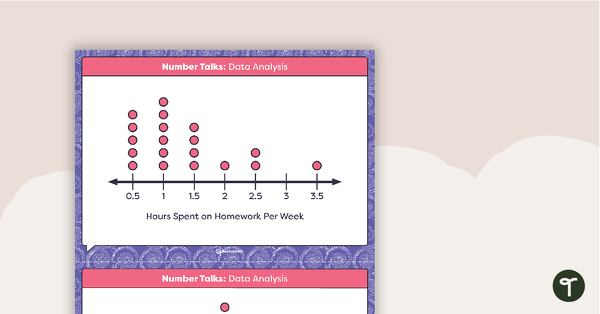
Number Talks - Data Analysis Task Cards
Build data analysis skills with this set of 26 task cards.
- Plus Plan
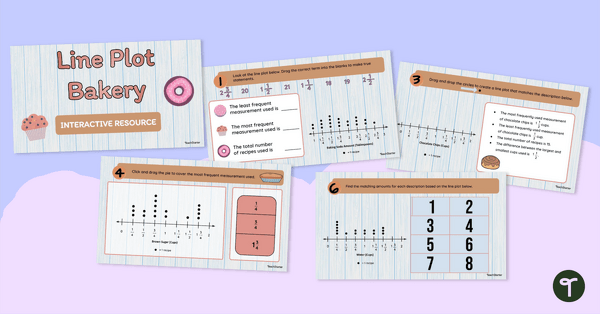
Dot Plot Bakery Interactive Activity
Strengthen dot plot skills with this bakery-themed interactive activity, designed to help students practise creating and analysing dot graphs in a fun, structured way.
- Plus Plan
Editable Blank Survey Template For Students
Organise student survey data with a set of printable blank survey templates.
- Plus Plan
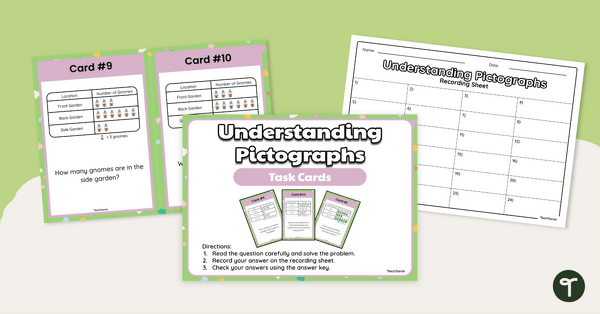
Understanding Pictographs - Task Cards
Use this set of task cards to practise reading and interpreting pictographs and bar graphs
- Free Plan
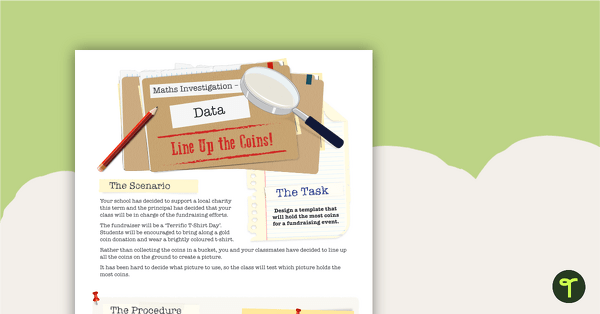
Data Maths Investigation – Line Up the Coins
A mathematics investigation about data, embedded in a real-world context.
- Plus Plan
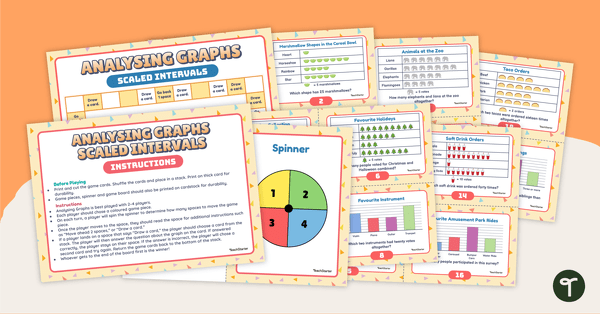
Analysing Graphs (Scaled Intervals) Board Game
Use this board game to sharpen data analysis skills when solving problems with information presented in a scaled picture or column graph.
- Plus Plan
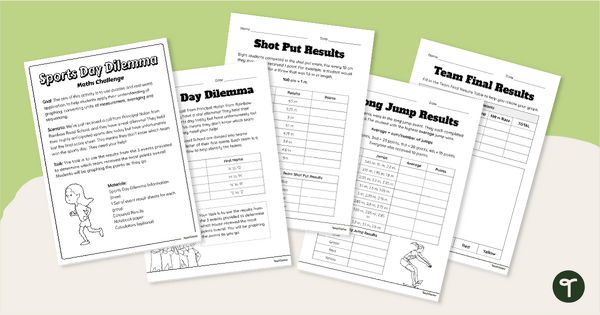
Sports Day Dilemma - Metric Conversions Maths Task
Engage students with a real-world application of measurement conversions with Sports Day Dilemma, a metric conversion maths task!
- Plus Plan
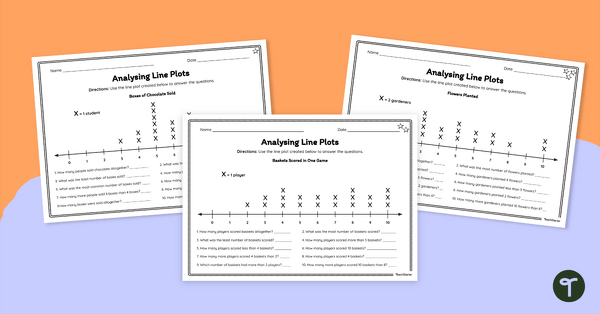
Analysing Line Plots – Differentiated Worksheets
Empower your students to become proficient data interpreters with this set of differentiated line plot worksheets.
- Plus Plan

Data Maths Investigation - Which Reward?
A mathematics investigation involving data collection and representation, embedded in a real-world context.
- Plus Plan
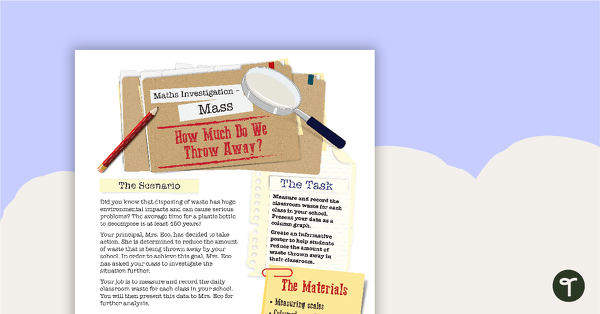
Mass Maths Investigation - How Much Do We Throw Away?
A mathematics investigation about measuring mass, embedded in a real-world context.
- Plus Plan
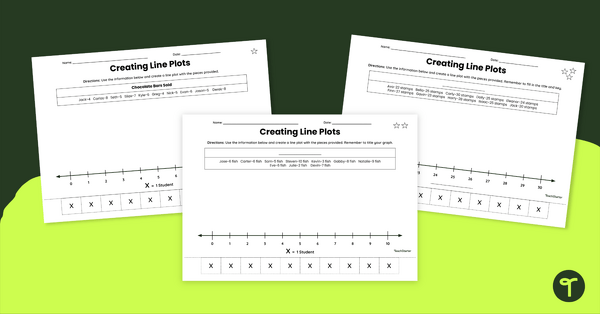
Creating Line Plots Differentiated Cut and Paste Worksheet
Guide students to create line plots with this differentiated cut and paste worksheet.
- Plus Plan
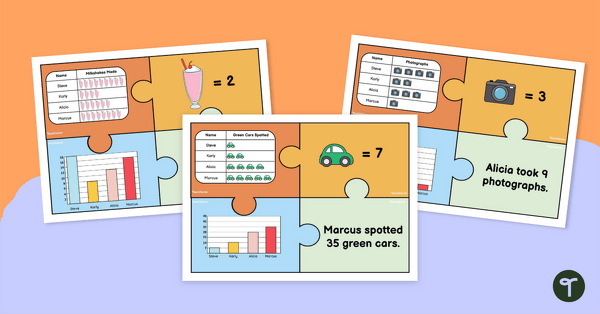
Pictograph Puzzles
Practise reading and interpreting pictographs with these fun puzzles which require students to match pictographs with other data displays with matching data.