Graphs and Data Teaching Resources
- Free Plan
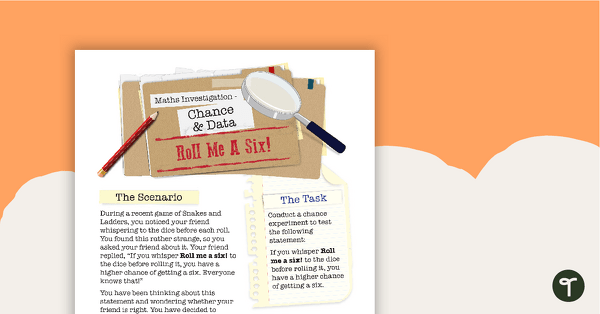
Chance and Data Maths Investigation - Roll Me a Six!
Explore probability, collect data and draw evidence-based conclusions through a hands-on dice experiment.
- Plus Plan
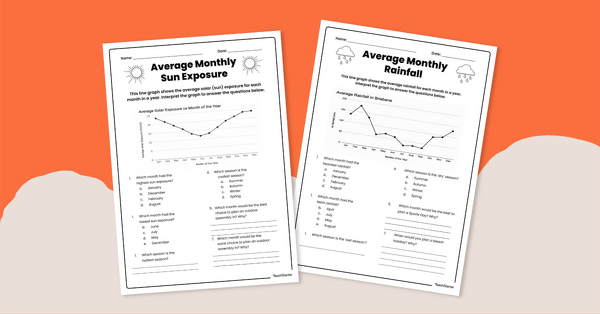
Interpreting Line Graphs Worksheet Pack
Use this set of 4 Grade 5 worksheets to help students practise interpreting real-life data represented as a line graph.
- Plus Plan
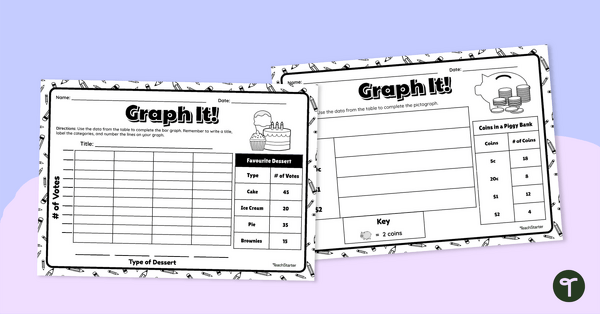
Graph It! Worksheet (Many-to-One Graphs)
Draw a scaled picture graph and bar graph to represent data with this worksheet.
- Plus Plan
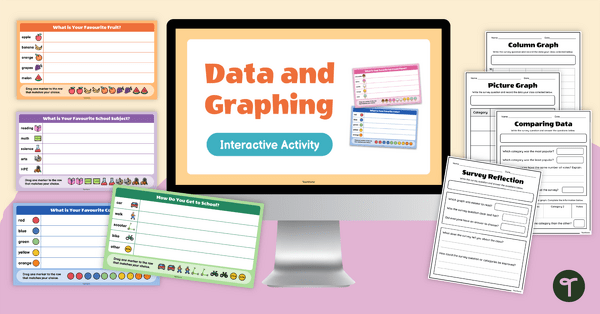
Year 2 Data and Graphing Interactive Slides with Graphing Templates
Explore data collection and graphing with this interactive resource, designed to help Year 2 students collect, represent and interpret data.
- Plus Plan
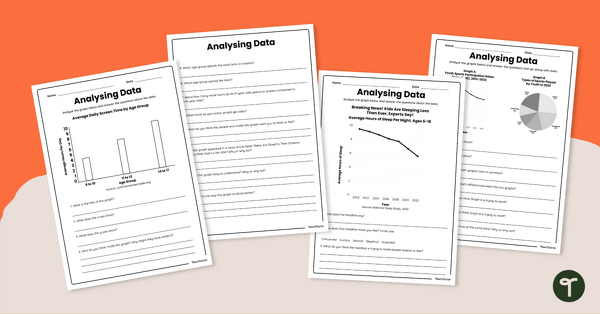
Analysing Data Worksheet Set
Share this analysing data worksheet set with your students to give them varied practice interpreting multiple data representations.
- Plus Plan
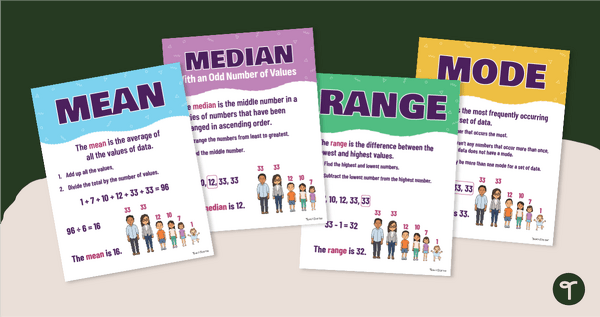
Mean, Median, Mode & Range Poster Pack
Download a Mean, Median, Mode & Range poster pack to help your students remember measures of central tendency.
- Plus Plan
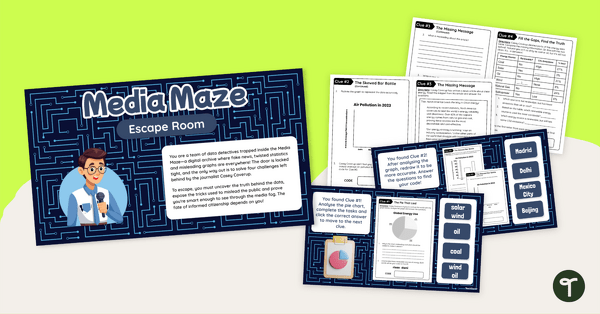
Interpreting Data Year 6 Escape Room
Play our interpreting data year 6 escape room to give your students engaging practise identifying and correcting misleading data displays.
- Plus Plan
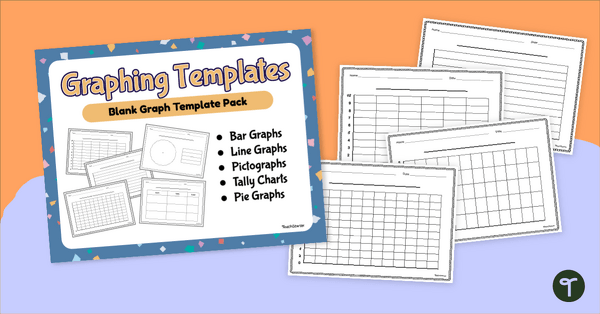
Blank Graph Template Pack
Construct your own graphs with a printable set of Blank Graph Templates.
- Plus Plan
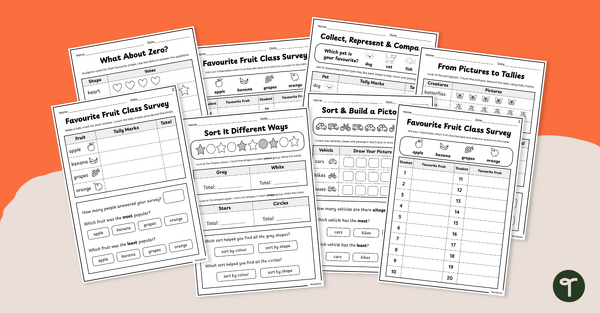
Collecting and Organising Data Worksheet Pack
Introduce students to the world of data and graphing with this engaging worksheet pack.
- Plus Plan
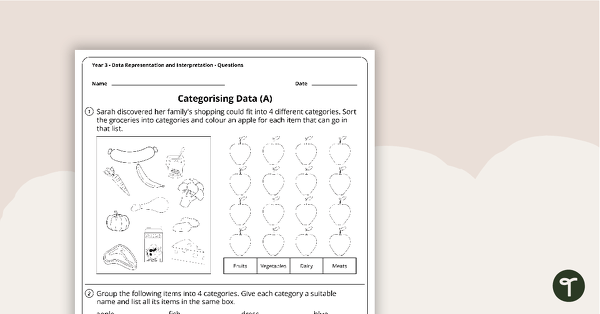
Data Representation and Interpretation Worksheets - Year 3
8 data representation and interpretation worksheets linked to the Australian Curriculum.
- Plus Plan
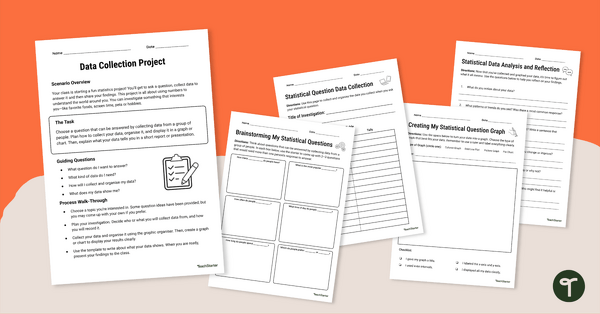
Data Collection Project
Complete this data collection project with your students to give them practise developing a statistical question, collecting data and displaying the results.
- Plus Plan
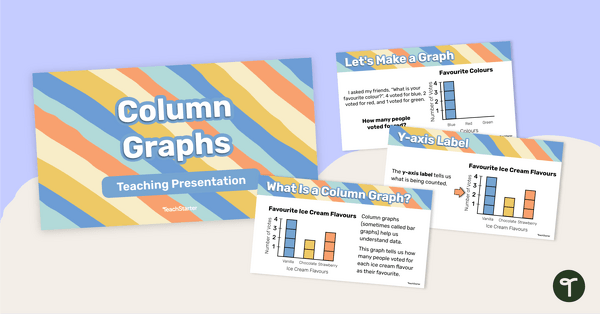
Column Graphs – Teaching Presentation
Learn all the features and how to construct a column graph with this 25-page teaching presentation.
- Plus Plan
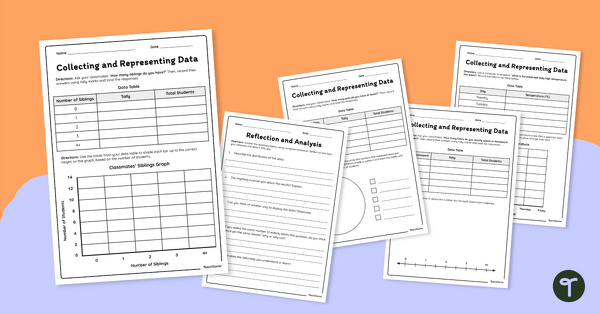
Collecting and Representing Data Worksheet Set
Download our collecting and representing data worksheet set to get your students collecting, organising and displaying data.
- Plus Plan
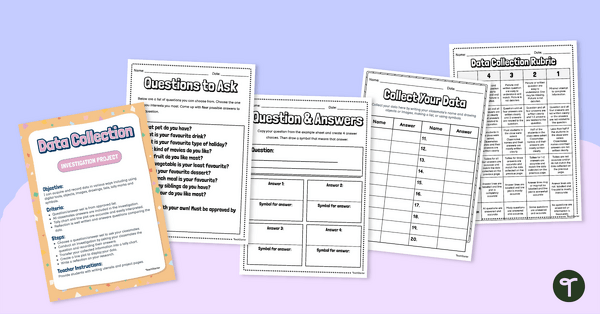
Data Collection Investigation Project
Assign this data collection project to enable students to master the skills of acquiring and recording data.
- Plus Plan
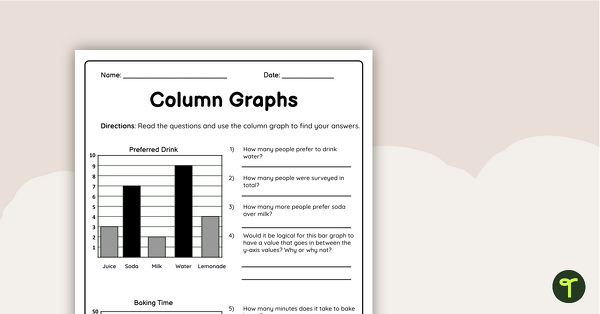
Column Graphs Grade 5 Worksheet
Use this double-sided column graphs worksheet to check your students’ understanding of interpreting and drawing column graphs.
- Plus Plan
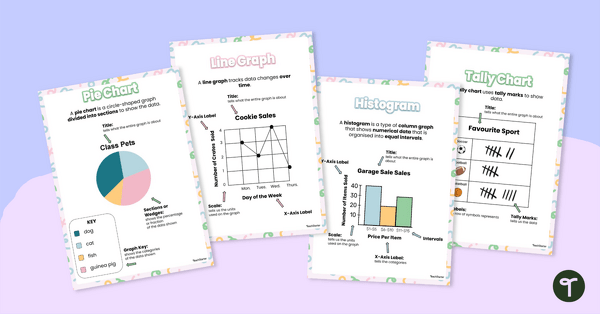
Types of Graphs Posters
Show students the varying data displays they will encounter in their primary maths lessons with these colourful and easy-to-digest visual posters.
- Free Plan
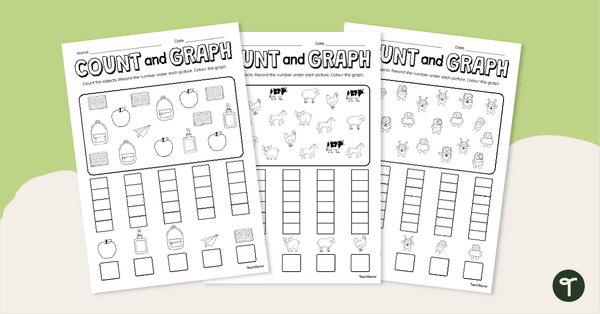
Count and Graph Worksheet Pack
Explore counting and graphing skills with this set of three worksheets.
- Plus Plan
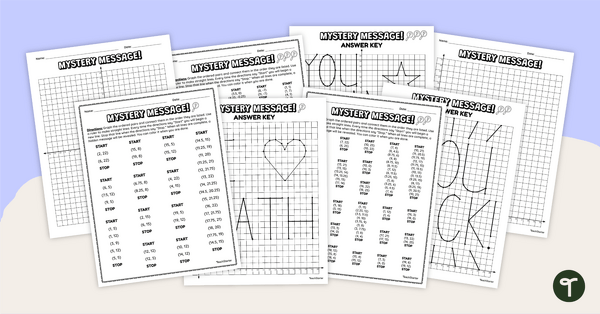
Cartesian Plane Mystery Pictures
Practise graphing on the Cartesian plane with this set of differentiated mystery pictures.
- Free Plan
Data Maths Investigation – Line Up the Coins
A mathematics investigation about data, embedded in a real-world context.
- Plus Plan
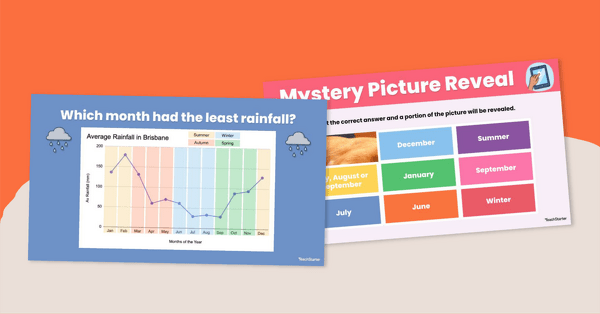
Interpreting Line Graphs Interactive Resource
Use this digital activity to teach students about interpreting real-life data represented as a line graph showing how measurements change over a period of time.
- Plus Plan
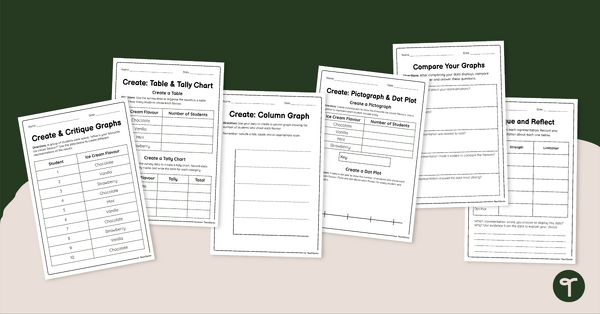
Year 4 Create and Critique - Comparing Graphs Worksheet Pack
Use this graph comparing worksheet activities to help students create, analyse and compare different data displays.
- Plus Plan
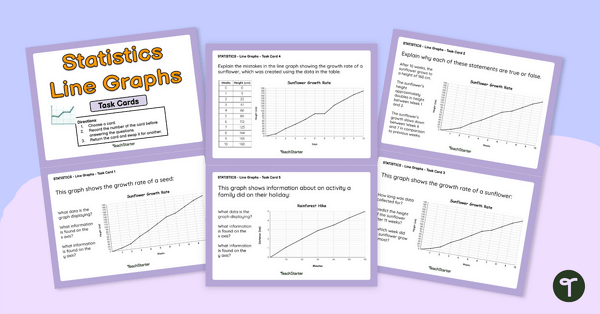
Interpreting Line Graphs Task Cards Grade 5
Use these task cards in your maths class to have students independently analyse and interpret line graphs.
- Plus Plan
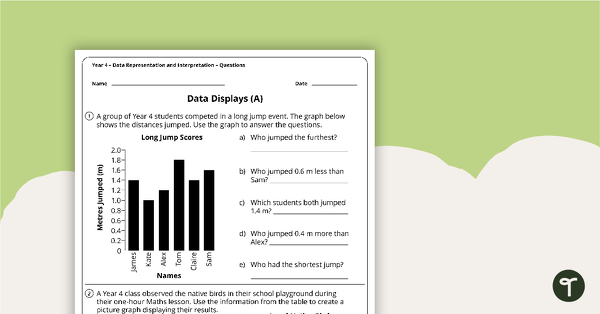
Data Representation and Interpretation Worksheets - Year 4
4 data representation and interpretation worksheets linked to the Australian Curriculum.
- Free Plan
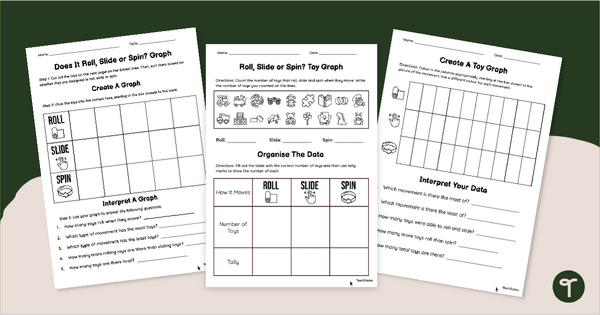
How Does It Move? Toy Graphing Worksheets
Explore motion and mathematics with engaging Toy Graphing Worksheets.
- Plus Plan
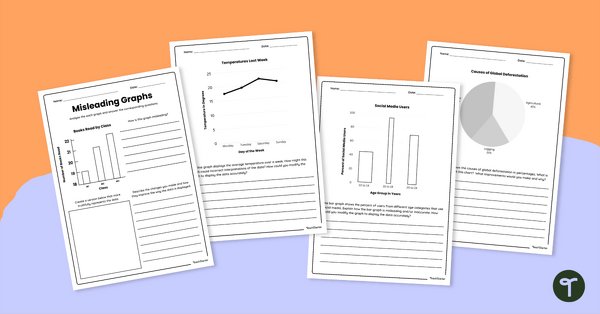
Misleading Graphs Worksheet Set
Download our misleading graphs worksheet set to increase your students’ abilities in statistical literacy and data analysis.
- Free Plan
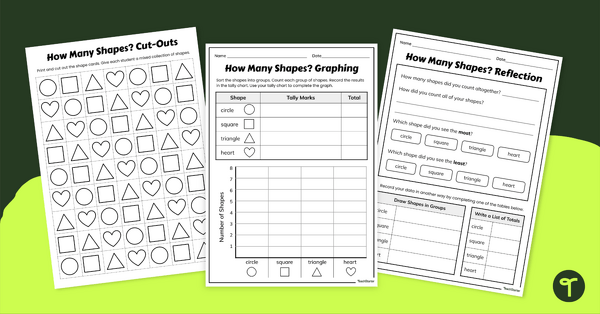
How Many Shapes? Graphing Activity
Develop early graphing skills with this engaging graphing worksheet pack, designed to help students sort, count and organise data while creating graphs using hands-on shape activities.
- Plus Plan
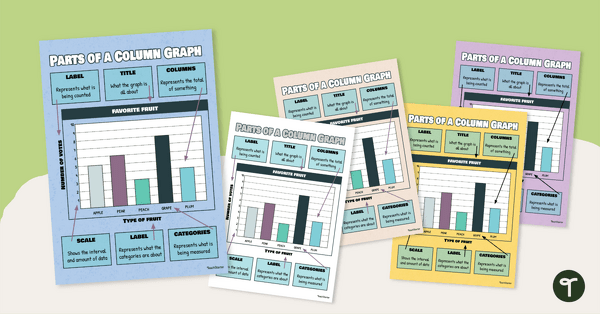
Column / Bar Graph Poster
Hang this column / bar graph poster in your classroom to teach your students about the different parts of this commonly used graph.
- Plus Plan
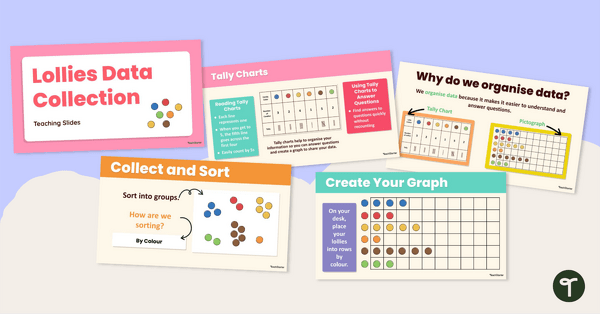
Lollies Data Collection Instructional Slide Deck
Explore this sweet-themed data collection teaching presentation to teach students the basics of recording data and creating a pictograph.
- Plus Plan
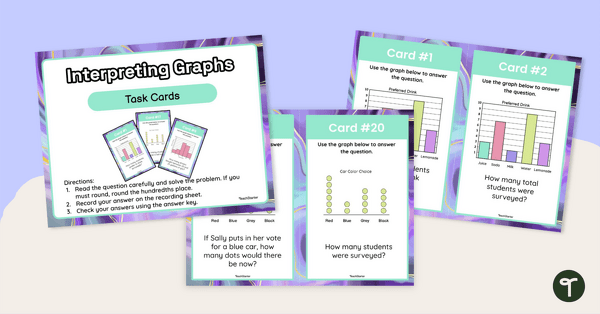
Interpreting Graphs Task Cards
Use this set of task cards students to practise interpreting column graphs, histograms and line plots.
- Free Plan
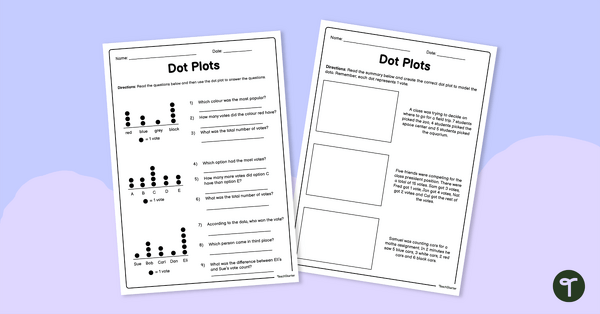
Dot Plot Worksheet
Practise analysing and creating single-unit dot plots with this free maths worksheet.
- Plus Plan
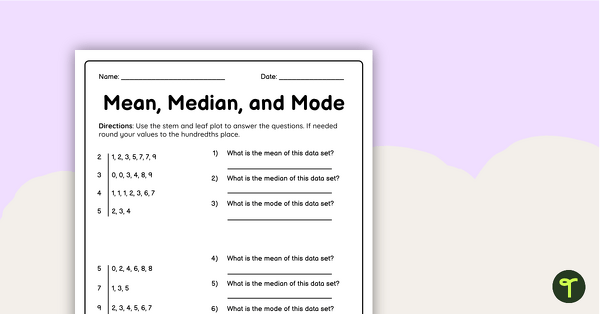
Mean Median Mode Worksheet
Use this double-sided worksheet to check students’ ability to find the mean, median and mode of given data sets.
- Plus Plan
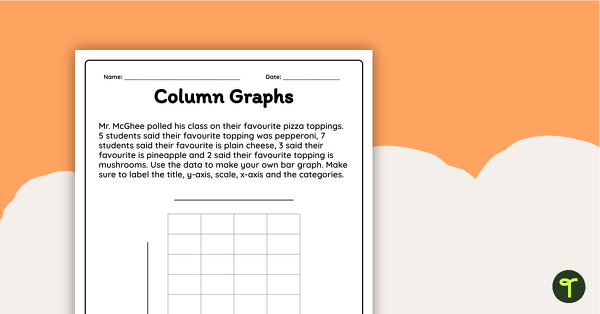
Creating a Bar Graph Worksheet
Interpret data and create a column graph display with this worksheet.